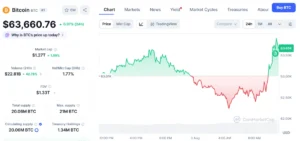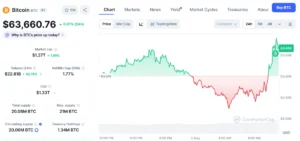
The cryptocurrency market is once again turning its attention to a historical forecast for Bitcoin, as price action aligns with a critical downside zone first highlighted months ago by crypto commentator Klarck. Originally posted in February, the "roadmap" outlined a multi-phase trajectory for Bitcoin, predicting an initial bounce, a subsequent decline into a specific range, a period of accumulation, and ultimately a significant upward move. The renewed interest stems from Bitcoin’s current proximity to the upper boundary of Klarck’s projected downside region, prompting a re-examination of the old prediction’s potential validity and broader implications for market sentiment and trading strategies.
The Genesis of the Forecast: Klarck’s February Projections
In February, amidst a period of considerable volatility and anticipation within the cryptocurrency space, X user Klarck published a detailed Bitcoin roadmap. This forecast, which quickly garnered attention from a segment of the crypto community, posited a sequence of price movements for the leading digital asset. Specifically, Klarck projected an initial upward trajectory, suggesting a bounce toward the $83,000 mark. Following this proposed ascent, the roadmap anticipated a gradual but significant correction, guiding Bitcoin’s price down into a defined range between $65,000 and $55,000. Within this crucial zone, the forecast suggested a two-week "accumulation phase," characterized by sideways trading and consolidation, before a subsequent transition back into sustained growth. The ultimate long-term projection embedded within this roadmap was an ambitious target of $140,000 per Bitcoin.
It is imperative to underscore that this roadmap is not a recent market analysis. Its origins in February mean that it predates several significant market developments and shifts in macroeconomic conditions. Therefore, it is not to be interpreted as a fresh signal or a real-time analyst update. Its current relevance is purely retrospective, derived from the fact that Bitcoin’s price has, several months later, moved into a position that echoes a key component of the original prediction. This phenomenon—where old technical analyses resurface as market conditions align with their projections—serves as a compelling case study in how traders and analysts often revisit historical cycle maps, using them as potential reference points when price action begins to validate parts of a previously laid out path. Such validation, however, does not inherently guarantee the accuracy of the entire prediction, nor does it assure the realization of later upside targets. Instead, it highlights the cyclical nature of market commentary and the persistent human tendency to seek patterns in price movements.
Bitcoin’s Journey: Tracing Price Action Against the Roadmap
To fully appreciate the renewed focus on Klarck’s February roadmap, it is essential to contextualize Bitcoin’s price movements since its initial publication. In February, Bitcoin was trading significantly below its current levels, having recently recovered from a slump that followed the euphoria of early 2024. The market was building momentum, driven by increasing institutional interest, anticipation of the Bitcoin Halving event, and growing optimism surrounding the newly approved spot Bitcoin Exchange-Traded Funds (ETFs) in the United States.
Following Klarck’s projection, Bitcoin did indeed experience a substantial rally, surpassing many expectations. The cryptocurrency reached a new all-time high in March, briefly touching levels above $73,000. While it did not precisely hit Klarck’s $83,000 target for the initial bounce, the general direction of a strong upward movement was largely observed, albeit with slightly different peak values. This surge was fueled by sustained inflows into spot Bitcoin ETFs, a bullish macro environment for risk assets, and the impending Halving event, which historically has been a catalyst for price appreciation due to a reduction in new Bitcoin supply.
However, after reaching these historic highs, Bitcoin entered a phase of consolidation and correction, a common occurrence after significant rallies. Throughout April and May, the price experienced increased volatility, grappling with profit-taking, shifts in global macroeconomic sentiment (such as changing expectations for interest rate cuts), and geopolitical uncertainties. It is this subsequent decline that has brought Bitcoin’s price increasingly closer to the upper end of Klarck’s specified downside range of $65,000-$55,000. This convergence has naturally reignited discussions around the foresight of the February roadmap, particularly as market participants seek to identify potential support levels and assess future price trajectories amidst ongoing price discovery and correction. The journey from February’s optimism through March’s highs to the current correctional phase provides a chronological backdrop against which Klarck’s initial forecast is now being re-evaluated.
The Critical Juncture: Why the $65,000-$55,000 Zone Matters
The current market focus is not on the long-term projection of $140,000, but rather on the immediate significance of the $65,000-$55,000 price range. When Klarck’s roadmap was first released, a call for a decline into this region might have appeared extreme, especially given Bitcoin’s prevailing price at the time. However, as Bitcoin has retreated from its all-time highs and is now trading around the upper bound of this specific zone, the forecast takes on renewed relevance.
This range is perceived as a critical support area, a psychological and technical threshold where buying interest is anticipated to potentially re-emerge, counteracting selling pressure. For many traders and analysts, these levels represent key inflection points that could dictate Bitcoin’s short-to-medium-term direction. A successful stabilization within this zone would lend credence to the "accumulation phase" described in Klarck’s roadmap, suggesting that sellers might be losing control and that a base could be forming for future upward movement.
Deconstructing the Roadmap: Key Technical Elements
Understanding the significance of Klarck’s roadmap requires an appreciation of the technical analysis concepts it implicitly employs. The mention of an "accumulation phase," "support zones," and "liquidity targets" are cornerstones of technical trading strategies.
-
The Accumulation Phase: A Closer Look: An accumulation phase, in technical analysis, refers to a period after a significant price decline where institutional investors and large holders begin to buy assets, often discreetly, without causing a rapid price increase. This typically manifests as a period of relatively tight price consolidation, characterized by lower trading volume compared to previous rallies or corrections, and a gradual shift from bearish to neutral sentiment. For Klarck’s roadmap, a two-week accumulation phase within the $65,000-$55,000 zone implies that Bitcoin would cease making lower lows, establish a relatively stable trading range, and exhibit signs of seller exhaustion, thereby setting the stage for a reversal. Traders would look for specific candlestick patterns, decreasing volatility, and potentially an increase in "on-chain" metrics indicative of long-term holder accumulation (e.g., Bitcoin moving off exchanges into cold storage).
-
Liquidity Targets and Downside Risk: Should Bitcoin fail to establish support and hold the upper end of the $65,000-$55,000 zone, the lower end near $55,000 could become the next critical "liquidity target." Liquidity targets are price levels where a high concentration of buy or sell orders is expected to reside, often corresponding to previous support/resistance levels, significant Fibonacci retracement levels, or areas where large numbers of stop-loss orders are clustered. A breach of the $65,000 level could trigger further selling pressure as stop-losses are hit and bearish sentiment intensifies, pushing the price towards the next major support, which Klarck’s roadmap implies is around $55,000. The concept of "cascading liquidations" is also relevant here, where forced selling can accelerate price declines once key liquidity zones are broken.
Broader Market Context: Macroeconomic Influences and Crypto Dynamics

The current re-evaluation of Klarck’s roadmap does not occur in a vacuum. The broader macroeconomic landscape and the inherent dynamics of the crypto market play significant roles in how such forecasts are perceived and how price action unfolds. In February, global inflation concerns were still prominent, but expectations for interest rate cuts by central banks, particularly the U.S. Federal Reserve, were beginning to solidify. This fostered a risk-on environment that benefited cryptocurrencies.
Fast forward to the present, and the macroeconomic picture is more nuanced. While inflation has shown signs of moderation, the path to sustained disinflation remains uneven. Central banks have adopted a more cautious stance on rate cuts, with some even hinting at potential rate hikes if inflationary pressures persist. This shift in monetary policy expectations can create headwinds for risk assets like Bitcoin, as higher interest rates make traditional, less volatile investments more attractive. Geopolitical tensions, global economic slowdowns, and regulatory uncertainties in various jurisdictions also contribute to market volatility and investor apprehension.
Within the crypto ecosystem itself, the market is continually evolving. The successful launch of spot Bitcoin ETFs has brought new capital into the space but also introduced a stronger correlation with traditional financial markets. This means Bitcoin is increasingly influenced by factors that affect equities and other conventional assets. Furthermore, the quadrennial Bitcoin Halving event, which occurred in April, reduced the supply of new Bitcoin entering the market. While historically a bullish catalyst, its immediate impact is often followed by a period of price discovery and consolidation as the market adjusts to the new supply dynamics. These multifactorial influences underscore that while a technical roadmap provides a framework, it must always be interpreted within the context of prevailing economic, political, and industry-specific developments.
Analyst Perspectives and Market Psychology
The re-emergence of Klarck’s February roadmap highlights a fascinating aspect of market psychology and the role of technical analysis. When an old forecast appears to be partially validated, it can generate significant buzz and influence market sentiment. This often leads to a form of confirmation bias, where traders may pay undue attention to the parts of the prediction that are playing out while potentially overlooking divergences or new information.
Leading crypto analysts and market observers generally concur that the $65,000-$55,000 range represents a significant area of interest for Bitcoin. Many independent analyses, employing various technical indicators and on-chain metrics, have also identified strong support levels within or around this zone. These independent validations, however, are based on current data and evolving market conditions, rather than a reliance on a single, months-old forecast. For instance, some analysts point to the realized price of short-term holders or the aggregate cost basis of Bitcoin held by entities within this price range as strong psychological and technical anchors.
From a broader market perspective, the revisiting of such roadmaps can serve multiple functions. For retail investors, it can be a source of both hope and anxiety. Hope, if the prediction aligns with their bullish outlook; anxiety, if it suggests further downside. For institutional players, while less likely to trade solely on an old social media post, the widespread discussion of such a roadmap can become a factor in market sentiment, potentially influencing short-term liquidity and trading behavior as a self-fulfilling prophecy begins to take hold. The collective consciousness around a specific price target or support zone, whether originating from an old roadmap or current analysis, can undeniably impact how market participants react as price approaches those levels.
The Perils and Promise of Historic Forecasts
There is a clear and present danger in attributing excessive weight to an outdated forecast, no matter how prescient it may seem in retrospect. Markets are dynamic entities, constantly influenced by a myriad of factors including macroeconomic shifts, geopolitical events, technological advancements, and regulatory changes. A forecast made months ago, even if meticulously crafted, cannot account for these unforeseen developments.
-
The Dangers of Confirmation Bias: Relying too heavily on an old post can lead to confirmation bias, where individuals selectively interpret new information in a way that confirms their existing beliefs or the original forecast. This can result in tunnel vision, causing traders to miss critical signals from current price action or evolving market fundamentals. A forecast might look accurate for a period, only to break down completely when underlying conditions change, leaving those who adhered strictly to it vulnerable to significant losses.
-
Utilizing Roadmaps as Reference Points: The more judicious approach to utilizing such historical calls is to treat them as reference points, not as definitive trading plans. They can provide a framework for understanding potential market levels that have been previously identified as significant. Klarck’s roadmap, for instance, has successfully highlighted a price zone that Bitcoin is now testing. This can help traders frame the current market context and identify levels where they might expect increased volatility, support, or resistance. However, any trading decision must be confirmed by current price action, real-time market data, and a thorough analysis of prevailing conditions. This involves scrutinizing volume profiles, candlestick patterns, order book depth, and other contemporary indicators to validate or invalidate the older projection. Robust risk management strategies, including setting stop-losses and diversifying portfolios, remain paramount, irrespective of any forecast.
Beyond the Immediate: The $140,000 Projection
While the immediate market attention is fixed on the $65,000-$55,000 downside zone, Klarck’s roadmap ultimately projects a long-term target of $140,000 per Bitcoin. This ambitious target represents a significant appreciation from current levels and would place Bitcoin well into uncharted territory.
For such a long-term projection to materialize, several conditions would likely need to align. Firstly, Bitcoin would need to successfully navigate the current correction and establish a strong accumulation base, as suggested by Klarck’s roadmap. Secondly, the broader macroeconomic environment would need to become more favorable, potentially through sustained global economic growth, a clear path for interest rate cuts, and continued institutional adoption of digital assets. Regulatory clarity and innovation within the cryptocurrency space would also play crucial roles.
Furthermore, a move to $140,000 would signify a new phase of market exuberance, likely driven by a combination of retail FOMO (fear of missing out) and sustained institutional investment. While technical roadmaps can provide potential pathways, achieving such lofty targets depends heavily on a confluence of fundamental, economic, and psychological factors that are inherently difficult to predict over extended periods. Therefore, while the $140,000 target offers a glimpse into a potential future, its realization remains contingent on a multitude of variables that extend far beyond the scope of a single historical technical analysis.
Conclusion: Navigating Uncertainty with Prudence
The re-emergence of Klarck’s February Bitcoin roadmap, as the cryptocurrency approaches a key downside zone, serves as a compelling reminder of the cyclical nature of market narratives and the enduring appeal of technical analysis. While the partial validation of an old forecast can be intriguing, it underscores the critical importance of a balanced and prudent approach to market interpretation. Traders and investors are cautioned against over-reliance on historical predictions, instead emphasizing the need for real-time data analysis, a comprehensive understanding of macroeconomic factors, and robust risk management strategies. Whether Bitcoin stabilizes within the $65,000-$55,000 range, enters an accumulation phase, or seeks lower liquidity targets, the path forward will ultimately be determined by the complex interplay of current market forces, rather than the isolated echoes of a past prediction. The question of whether the entirety of Klarck’s roadmap, including its ambitious $140,000 target, will ultimately play out remains an open and highly debated subject in the dynamic world of cryptocurrency.