Leading cryptocurrency analysts are forecasting a significant price correction for Bitcoin (BTC) in the coming market cycle, with a potential bottom projected for October 2026. These bearish outlooks are primarily based on historical market patterns, including a consistent 400-day cycle and technical indicators like the Moving Average Convergence Divergence (MACD). Experts suggest that despite recent market activity and the introduction of new financial instruments, Bitcoin could still face substantial downside before a long-term recovery stage commences, potentially declining by over 75% from its perceived peak in this cycle.
Analyst Bee’s "400-Day Cycle" Theory and October 2026 Bottom
Crypto market analyst Bee, known for his rigorous application of historical market trends, has outlined a definitive timeline for the conclusion of the current Bitcoin bear market. His comprehensive analysis, disseminated via the social media platform X, hinges on a specific 400-day cycle pattern that has demonstrably guided both market tops and bottoms throughout Bitcoin’s 13-year trading history. This recurring pattern offers a framework for understanding the ebb and flow of market sentiment and price action, providing a historical lens through which to view future movements.
According to Bee’s intricate framework, Bitcoin is currently positioned 252 days into what he identifies as its cyclical bear phase. Historically, this phase has consistently endured for a duration ranging between 364 and 400 days. This observation leads to the critical implication that the world’s leading cryptocurrency could still be subjected to an additional 112 to 148 days of significant downward pressure. This protracted period of price depreciation is anticipated to precede any genuine and sustainable recovery, testing the resilience of investors.
Projecting forward based on the established timeline of this historical setup, Bee estimates that Bitcoin’s absolute price bottom for the current cycle could materialize in October 2026. His detailed calculations, visually articulated in an accompanying chart, indicate that Bitcoin’s price could descend to as low as $30,000 by the first week of that month. Such a decline would represent a staggering more than 75% drop from what the analyst projects as an eventual all-time high near $126,000 within this market cycle. This projected nadir would likely mark the floor before the commencement of the next significant recovery and subsequent bull run.
The 400-day cycle is not an isolated phenomenon; Bee notes that it typically follows a preceding bull run that historically lasts approximately 1,064 days. This cyclical interplay suggests a natural market reset once the final cycle bottom is achieved, effectively paving the way for a fresh bull market characterized by renewed investor optimism and upward price momentum. Understanding this dual-phase structure—the prolonged bull run followed by a corrective bear market—is crucial for long-term investors aiming to navigate Bitcoin’s volatile landscape.
Challenging the "New Paradigm" Narrative: The ETF Factor

A common argument gaining traction among some market participants is that the current market dynamics diverge significantly from past trends, primarily due to the advent of Exchange-Traded Funds (ETFs) and the increased involvement of institutional players such as BlackRock, the world’s largest Bitcoin ETF provider. The introduction of spot Bitcoin ETFs in major markets, particularly in the United States, was widely hailed as a watershed moment, promising greater institutional adoption, enhanced liquidity, and a more stable, mature market. Many speculated that these factors would either mitigate the severity of future bear markets or fundamentally alter Bitcoin’s historical price cycles.
However, analyst Bee vehemently counters this "new paradigm" perspective. He argues that while new market instruments and participants may introduce novel elements, the underlying human psychology and market structure that drive these cycles remain remarkably consistent. Bee points out that each preceding cycle had its own set of "unique" or "different" factors that market participants believed would break historical patterns. Yet, despite these perceived differences—be it the rise of specific exchanges, new regulatory landscapes, or evolving narratives—the historical 400-day pattern has persisted without a single deviation for over a decade.
He emphasizes that this recurring structure has consistently held true through numerous shifts in market narratives, technological advancements, and broader macroeconomic developments. Consequently, Bee finds no compelling reason to believe that the current cycle, despite the significant institutional inflows facilitated by ETFs, will behave any differently in its fundamental cyclical progression. This steadfast adherence to historical patterns underscores the powerful influence of market psychology and inherent supply-demand dynamics that appear to transcend specific market innovations.
Analyst Ted Pillows and the MACD Indicator: A Concurring Outlook
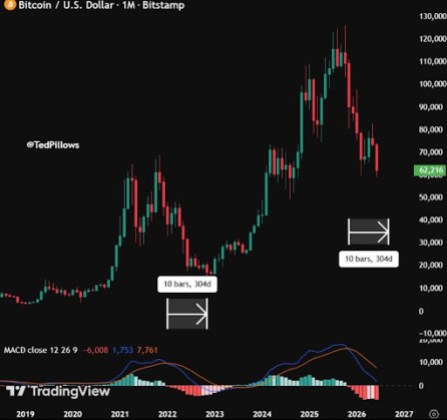
In a separate but remarkably convergent analysis, crypto analyst Ted Pillows has also offered a timeline for Bitcoin’s bear market bottom, reinforcing the sentiment of a late 2026 trough. Pillows’ methodology, shared on X, draws upon the behavior of the monthly Moving Average Convergence Divergence (MACD) indicator, a widely used momentum oscillator in technical analysis. The MACD reveals the relationship between two moving averages of a security’s price, and a "bearish cross" typically signals a shift from bullish to bearish momentum.
Pillows observed that following a monthly MACD bearish cross in 2022, Bitcoin subsequently took approximately 10 months to establish its definitive bottom. This historical precedent provides a crucial benchmark for his current projections. Applying a similar analytical lens to the present market cycle, Pillows forecasts that if a comparable trend unfolds, Bitcoin is likely to achieve its final price floor either by the end of the third quarter (Q3) of 2026 or the beginning of the fourth quarter (Q4). His accompanying chart visually supports this projection, pointing towards a probable bottom target range situated between $30,000 and $40,000.
Furthermore, Pillows’ analysis explicitly dampens expectations for a substantial long-term rebound within the immediate future. He projects that a bullish run pushing Bitcoin back toward the $100,000 mark is highly improbable in 2026. This assertion directly contradicts more optimistic forecasts that anticipate a rapid recovery and significant price appreciation following the Bitcoin halving events. Pillows’ conservative outlook suggests a more protracted period of consolidation and accumulation before Bitcoin can embark on its next major parabolic ascent, aligning with Bee’s prediction of a prolonged bear market extending into late 2026.
Historical Context of Bitcoin Bear Markets

To fully appreciate the gravity of these predictions, it is essential to contextualize them within Bitcoin’s history of market cycles. Bitcoin has experienced several major bull and bear markets since its inception, often correlating with its quadrennial halving events. Each bear market has seen significant drawdowns from previous all-time highs:
- 2013-2015 Bear Market: Following a peak near $1,200 in late 2013, Bitcoin plunged by over 80% to lows around $200. This period lasted well over a year.
- 2017-2018 Bear Market: After reaching nearly $20,000 in December 2017, Bitcoin corrected sharply, falling by approximately 84% to around $3,200 by late 2018. This "crypto winter" was particularly brutal for many new investors.
- 2021-2022 Bear Market: From its peak near $69,000 in November 2021, Bitcoin declined by over 75% to lows around $15,500 by late 2022. This cycle saw a confluence of macroeconomic headwinds and the collapse of major crypto entities.
The analysts’ projection of a 75% decline from a potential $126,000 high to $30,000 aligns closely with the magnitude of corrections observed in previous bear markets. This consistency reinforces their belief in the enduring nature of these cyclical patterns, suggesting that while the absolute price points change, the percentage drawdowns often remain within a similar historical range.
Broader Economic Factors Influencing Crypto
While technical analysis provides valuable insights into market structure and investor behavior, the broader macroeconomic landscape plays an undeniable role in shaping asset prices, including Bitcoin. Global economic conditions, monetary policy decisions by central banks, and geopolitical events can significantly amplify or mitigate the effects of internal market cycles.
Factors such as inflation rates, interest rate hikes, and quantitative tightening policies have historically put downward pressure on risk assets like cryptocurrencies. When central banks raise interest rates to combat inflation, the cost of borrowing increases, making speculative investments less attractive and encouraging a flight to safer assets. Conversely, periods of quantitative easing and lower interest rates tend to fuel risk-on sentiment, benefiting assets like Bitcoin.
In 2026, the global economic environment could be vastly different from today. Potential scenarios include a global recession, continued inflationary pressures, or a return to a more stable, low-inflation environment. Each scenario would have distinct implications for Bitcoin’s recovery path. A severe economic downturn, for instance, could exacerbate a crypto bear market, potentially pushing prices even lower than current projections, or prolonging the period of stagnation. Conversely, a robust global economic recovery could accelerate Bitcoin’s next bull run once the predicted bottom is reached.
The Halving Cycle and Its Interplay
A fundamental aspect of Bitcoin’s supply economics is the "halving" event, which occurs approximately every four years. During a halving, the reward for mining new blocks is cut in half, reducing the rate at which new Bitcoin enters circulation. Historically, halvings have been strong catalysts for subsequent bull markets, as the reduced supply often clashes with steady or increasing demand, leading to price appreciation.
The most recent Bitcoin halving occurred in April 2024. If the analysts’ predictions for a late 2026 bottom hold true, it implies a more protracted post-halving accumulation and consolidation phase than some more optimistic models suggest. Typically, the peak of a bull market often occurs 12-18 months after a halving. A bottom in late 2026 would mean the market experiences a significant correction after the initial post-halving enthusiasm, before potentially setting up for the next major bull run cycle, perhaps aligning with the halving due in 2028. This suggests that the halving’s immediate impact might be overshadowed by broader market cycles and macroeconomic conditions in the short to medium term.
Implications for Investors and Market Sentiment
A projected Bitcoin bottom of $30,000-$40,000 in late 2026 carries significant implications for various investor cohorts. For long-term holders (HODLers) who purchased Bitcoin at higher prices, this period could represent a challenging test of conviction, potentially requiring them to endure further unrealized losses. However, for strategic investors with capital on the sidelines, such a decline could present a compelling accumulation opportunity, allowing them to acquire Bitcoin at a substantial discount before the anticipated next bull market.
The sentiment among retail investors, often driven by fear and greed, is likely to be heavily influenced by prolonged downward pressure. Extended bear markets frequently lead to "capitulation" events, where disillusioned investors sell their holdings at a loss, often near the market bottom. Institutional investors, with their longer investment horizons and sophisticated risk management strategies, may view these periods as strategic entry points, potentially increasing their Bitcoin allocations at reduced prices. The narrative around Bitcoin’s role as a "digital gold" or inflation hedge will also be scrutinized during such a downturn, as its volatility continues to challenge its perception as a stable store of value in the short term.
Alternative Perspectives and Future Outlook
While the analyses from Bee and Ted Pillows offer a compelling, data-driven perspective on Bitcoin’s future trajectory, it is crucial to acknowledge that market predictions are inherently speculative. Other analysts and models present alternative viewpoints. Some models, such as the Stock-to-Flow model, project significantly higher prices for Bitcoin post-halving, often suggesting a faster recovery and new all-time highs well before late 2026. Proponents of these models often emphasize the scarcity aspect of Bitcoin and its growing network effect.
Furthermore, unforeseen "black swan" events—be they regulatory crackdowns, technological breakthroughs, or major geopolitical shifts—could drastically alter any current projections. The increasing integration of Bitcoin into traditional finance through products like ETFs could also lead to a more muted volatility profile over time, potentially softening the severity of future bear markets, even if the cyclical patterns persist in some form.
Ultimately, while historical patterns offer a powerful guide, the future of Bitcoin remains subject to a complex interplay of technical indicators, macroeconomic forces, and evolving market sentiment. The predictions of a late 2026 bottom serve as a stark reminder of Bitcoin’s inherent volatility and the importance of long-term perspective and disciplined investment strategies in navigating the cryptocurrency markets. Investors are advised to conduct their own thorough research and consider multiple analytical perspectives before making investment decisions.