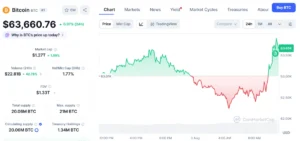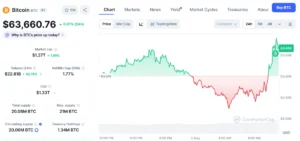
An older Bitcoin roadmap, originally disseminated by crypto commentator Klarck in February, is drawing significant attention once again as the flagship cryptocurrency’s market movements have brought its price squarely into one of the critical downside zones identified months prior. This re-evaluation underscores the cyclical nature of market analysis and how historical projections can regain relevance when actual price action begins to validate parts of their trajectory. The initial post, far from being fresh market commentary, serves as a compelling case study in the revisiting of long-term technical forecasts as the market evolves.
The Genesis of Klarck’s Bitcoin Roadmap
In February, the prominent X (formerly Twitter) user Klarck published a detailed Bitcoin roadmap outlining a multi-stage trajectory for the digital asset. The initial phase of this projection called for a significant upward movement, specifically a bounce towards the $83,000 mark. Following this anticipated rally, the roadmap then forecast a gradual but sustained decline, bringing Bitcoin into a critical support region identified as the $65,000 to $55,000 range. Klarck’s analysis further suggested that upon reaching this zone, Bitcoin would enter a two-week accumulation phase, characterized by horizontal price action and a consolidation of market interest. The ultimate culmination of this roadmap was a projected transition back into a robust growth trend, culminating in an ambitious target of $140,000 per Bitcoin.
It is crucial to contextualize Klarck’s position as a "crypto commentator." Such individuals often leverage a blend of technical analysis, on-chain data, and market sentiment to construct their projections. While these roadmaps provide valuable frameworks for understanding potential market cycles, they are inherently speculative and subject to the myriad unpredictable factors that influence the volatile cryptocurrency landscape. The original post was not presented as immediate trading advice but rather a long-term cyclical analysis, a distinction that becomes increasingly important as the market navigates its complex path.
Bitcoin’s Journey: From February Projections to Current Realities
To fully appreciate the renewed focus on Klarck’s roadmap, it is essential to trace Bitcoin’s price performance since February. At the time of Klarck’s initial post, Bitcoin was trading significantly lower than its subsequent highs. Following a strong upward trend that began in late 2023, the cryptocurrency experienced a dramatic surge in the early months of 2024, largely fueled by the approval and launch of spot Bitcoin Exchange-Traded Funds (ETFs) in the United States. This institutional inflow, coupled with increasing retail interest, propelled Bitcoin to unprecedented levels.
While Klarck’s roadmap projected a bounce "towards $83,000," Bitcoin’s actual market performance surpassed this interim target. The asset reached a new all-time high of approximately $73,794 in mid-March, exceeding all previous price records. This remarkable rally demonstrated the intense bullish sentiment that characterized the market during that period. However, as is common in cryptocurrency markets, this parabolic ascent was followed by a period of correction and consolidation.
Throughout late March and April, Bitcoin experienced a significant retracement from its all-time highs. This downward pressure was influenced by a combination of factors, including profit-taking by early investors, a general cooling of market exuberance, and broader macroeconomic concerns. As the price steadily declined, it began to approach the upper boundary of the $65,000 to $55,000 downside zone that Klarck had identified months earlier. This convergence of actual price action with a specific, previously forecast range is precisely what has brought Klarck’s older roadmap back into the spotlight. The market’s current position near the top of this anticipated support range is why traders and analysts are now re-evaluating the potential validity of the subsequent phases outlined in the February projection.
The Critical $65,000-$55,000 Zone: A Deep Dive into Market Significance
The $65,000 to $55,000 price corridor is currently the most pertinent aspect of Klarck’s roadmap. When Bitcoin was trading significantly above this range, a call for a decline into it might have appeared extreme or unlikely. However, as the price has systematically corrected and moved closer to the upper end of this zone, its relevance has dramatically increased. This region is not merely an arbitrary set of numbers; it represents a confluence of potential technical support levels that market participants often monitor.
From a technical analysis perspective, such a zone can be interpreted as a significant area of demand, where previous price action or key indicators suggest that buying interest may emerge to halt further declines. This could be due to factors such as:
- Previous Support/Resistance Levels: Historical price charts often reveal levels where Bitcoin found support on prior dips or faced resistance during upward movements. These areas can flip roles, with old resistance becoming new support.
- Fibonacci Retracement Levels: Many traders utilize Fibonacci retracement tools to identify potential reversal points after a significant price move. The $65,000-$55,000 range might correspond to key Fibonacci levels (e.g., 0.382, 0.5, or 0.618 retracement from the recent all-time high).
- Moving Averages: Long-term moving averages (e.g., the 50-day, 100-day, or 200-day simple or exponential moving averages) often act as dynamic support levels. Price interacting with these averages within the specified range would add further technical validation.
- Liquidity Pools: In crypto markets, "liquidity targets" refer to price levels where a large volume of buy or sell orders are concentrated. These can act as magnets for price, and the $55,000 mark, in particular, might represent a significant liquidity pool where strong buying pressure is anticipated.
If Bitcoin successfully stabilizes within this $65,000-$55,000 zone, the next phase outlined in Klarck’s roadmap – the "two-week accumulation phase" – would become the focal point. This would require Bitcoin to cease making lower lows, establish a tighter trading range, and exhibit signs that selling pressure is diminishing, with buyers gradually gaining control. Such an accumulation phase is typically characterized by decreased volatility and a balance between buyers and sellers, often preceding a renewed upward trend.
Conversely, if Bitcoin fails to hold the upper end of this critical zone and breaks below $65,000 with conviction, market sentiment could shift more negatively. In such a scenario, traders would likely turn their attention to the lower end of the range, specifically the $55,000 mark, as the next potential liquidity target or psychological support level. A decisive break below even $55,000 could signal a deeper correction, potentially invalidating the bullish recovery portion of Klarck’s roadmap in the near term.

Broader Market Context and Macroeconomic Influences
The current relevance of Klarck’s roadmap cannot be fully understood in isolation. Bitcoin’s price action is inextricably linked to broader market sentiment, macroeconomic conditions, and the evolving landscape of digital asset adoption. Several key factors are currently influencing the cryptocurrency market:
- Inflation and Interest Rates: Persistent inflation and the monetary policy responses from central banks, particularly the U.S. Federal Reserve, exert significant influence. Higher interest rates typically reduce liquidity in the market, making risk assets like Bitcoin less attractive. Any signals regarding rate cuts or hikes can trigger substantial market movements.
- Geopolitical Events: Global instability, conflicts, and political developments can lead to risk-off sentiment, causing investors to shy away from volatile assets. Conversely, Bitcoin is sometimes seen as a "safe haven" in certain contexts, but its price typically reflects broader risk appetite.
- Institutional Adoption and ETF Flows: The performance of the spot Bitcoin ETFs remains a critical barometer. Sustained net inflows indicate strong institutional demand, providing a floor for prices. However, periods of net outflows can signal waning interest or profit-taking, contributing to downward pressure. The initial post-ETF rally demonstrated the power of this institutional gateway, and its continued impact will be vital.
- Halving Event Impact: Bitcoin’s quadrennial halving event, which reduces the supply of new Bitcoin entering the market, is a significant long-term bullish catalyst. The most recent halving occurred in April, and historical patterns suggest that the full price impact typically unfolds over the subsequent 12-18 months. However, the market may already be pricing in some of this effect, or other factors could temporarily overshadow it.
- Regulatory Environment: Clarity or uncertainty in global cryptocurrency regulations can significantly impact investor confidence. Favorable regulatory frameworks can attract more capital, while restrictive measures can deter investment.
These overarching factors create a complex backdrop against which Klarck’s specific technical roadmap is being re-evaluated. While technical analysis provides a framework for understanding price movements, macroeconomics often dictates the broader trend and market sentiment.
The Nature of Predictive Models: Utility and Limitations
The crypto space is replete with "roadmaps," "cycle maps," and various predictive models. Their appeal lies in offering a structured narrative to the often chaotic movements of digital assets. They serve several utilities:
- Reference Points: They provide specific price levels and timeframes that traders and investors can use as reference points for their own analysis.
- Framework for Thinking: They help market participants organize their thoughts about potential future scenarios, prompting them to consider different outcomes.
- Psychological Anchors: In highly emotional markets, a clear roadmap can offer a sense of direction, helping to manage expectations.
However, these models also come with inherent limitations:
- Market Volatility: Cryptocurrencies are notoriously volatile, often experiencing rapid and unpredictable price swings that can quickly invalidate even well-researched forecasts.
- Black Swan Events: Unforeseen events—such as major hacks, regulatory crackdowns, or global economic crises—can fundamentally alter market dynamics in ways no model can predict.
- Changing Fundamentals: The underlying technology, adoption rates, and competitive landscape of cryptocurrencies evolve rapidly, potentially shifting the fundamental value proposition of assets.
- Self-Fulfilling Prophecies vs. Independent Validation: While some widely followed forecasts can sometimes create a degree of self-fulfilling prophecy, their ultimate validity still depends on broader market forces.
The current situation with Klarck’s roadmap highlights this dynamic tension. Its renewed relevance stems from independent market action converging with a specific part of the projection, not simply because it was a popular forecast.
Expert Perspectives and Cautionary Notes for Traders
When considering old forecasts, industry experts consistently advise extreme caution. Giving too much weight to a prediction made months ago carries clear dangers. Markets are dynamic; macro conditions shift, liquidity patterns change, and the sentiment of millions of participants can swing rapidly. A forecast that appears accurate for a period can break down completely when new information emerges or underlying conditions change.
Leading analysts frequently emphasize the following:
- Continuous Reassessment: Traders and investors should not rely on static predictions. Instead, they must continuously reassess market conditions, update their analysis based on new data, and remain flexible in their strategies.
- Confirmation from Current Price Action: An old roadmap should function as a reference point, not a rigid trading plan. Its validity must be confirmed by current price action, volume analysis, and other contemporaneous technical and fundamental indicators. For instance, if Bitcoin is in the $65,000-$55,000 range, traders would look for signs of accumulation (e.g., decreasing volume on dips, increasing volume on rallies, bullish divergence on oscillators) rather than blindly assuming the next phase will play out.
- Risk Management: Implementing robust risk management strategies, including setting stop-losses and diversifying portfolios, is paramount. No single forecast, regardless of its initial accuracy, guarantees future outcomes.
- Holistic View: A comprehensive understanding of the market involves not just technical analysis but also an appreciation for fundamental developments, macroeconomic trends, and market psychology.
For now, Klarck’s February roadmap serves as a compelling reminder of how technical analysis can provide long-term frameworks. However, whether the rest of the path, including the critical accumulation phase and the ambitious $140,000 target, will unfold as predicted remains an open and intensely debated question, requiring vigilant observation of ongoing market developments.
Looking Ahead: The Path to $140,000 and Beyond
While the immediate focus is on the $65,000-$55,000 range, the ultimate projection of $140,000 per BTC outlined in Klarck’s roadmap beckons a look into the long-term potential of Bitcoin. For such an ambitious target to materialize, several conditions would likely need to align:
- Sustained Institutional Demand: Continued and growing inflows into spot Bitcoin ETFs, along with broader institutional adoption across traditional finance, would provide significant buying pressure.
- Favorable Regulatory Environment: Clear, supportive regulatory frameworks in major economies would reduce uncertainty and encourage greater participation from both institutional and retail investors.
- Continued Halving Cycle Effects: The historical pattern of Bitcoin rallies following halving events, driven by supply shock, would need to persist.
- Broader Economic Recovery: A global economic environment characterized by moderate growth, controlled inflation, and stable interest rates would generally favor risk assets.
- Technological Advancements and Network Growth: Continued development of the Bitcoin network (e.g., Lightning Network adoption, scalability improvements) and increasing utility would strengthen its fundamental value proposition.
- Diminished Competition: While unlikely, a scenario where Bitcoin maintains its dominance against other cryptocurrencies without significant market share erosion would also be a factor.
The path to $140,000 is inherently speculative and subject to numerous variables. While long-term cycle maps provide intriguing possibilities, they are best viewed as aspirational frameworks rather than definitive predictions. The current moment, with Bitcoin testing a key support zone identified months ago, serves as a powerful testament to the occasional prescience of such analyses. Yet, the future of the world’s leading cryptocurrency will ultimately be determined by the collective actions of market participants, evolving macroeconomics, and the relentless march of technological and societal change. The unfolding narrative of Klarck’s roadmap underscores the enduring fascination with predicting market movements and the critical importance of balancing historical analysis with real-time market validation.