Bitcoin’s recent price action has transitioned from the euphoric highs observed earlier in the year, moving away from levels that once bolstered strong bullish confidence. The leading cryptocurrency has now descended into a critical Dollar-Cost Averaging (DCA) zone, a region historically associated with periods of heightened market fear, depressed sentiment, and quiet long-term accumulation opportunities. This shift has drawn the attention of market analysts, who are observing a pattern reminiscent of previous cycles where Bitcoin bottomed out before significant rallies. The prevailing sentiment indicates a pivotal moment for investors, as the market grapples with a mix of technical signals and macroeconomic pressures.
Understanding the Dollar-Cost Averaging Zone in Bitcoin Cycles
The concept of a Dollar-Cost Averaging zone is fundamental in investment strategies, advocating for regular, fixed-amount investments over time, regardless of price fluctuations. In the context of Bitcoin, this zone typically refers to a price range where the asset is perceived as undervalued by long-term holders, often coinciding with periods when retail investor enthusiasm wanes and fear dominates headlines. Historically, these zones have represented strategic entry points for patient investors looking to accumulate Bitcoin at a discount, anticipating future growth. Analyst Ardizor, commenting on X, highlighted that Bitcoin’s current position aligns precisely with these historical accumulation phases that preceded major market recoveries. The recurring narrative involves market declarations of Bitcoin’s demise, followed by its entry into this long-term DCA region, culminating in a subsequent rally to new all-time highs. This pattern suggests a cyclical nature to Bitcoin’s market behavior, where periods of despair ultimately pave the way for renewed optimism and price appreciation.
The significance of this zone lies in its psychological and technical implications. Psychologically, it marks a phase of "maximum pain" for short-term traders and weak hands, often driving capitulation. Technically, it frequently corresponds with strong, long-term support levels that have proven resilient in past downturns. For those employing a DCA strategy, these periods are not viewed as bearish downturns but rather as extended opportunities to acquire more assets at a lower average cost, betting on the asset’s long-term value proposition. The current market environment, characterized by diminished euphoria and increased apprehension, appears to be mirroring these historical precedents, prompting a closer examination of Bitcoin’s trajectory.
Chronology of Past Accumulation Cycles: Lessons from 2019 and 2022
To contextualize the current market phase, it is crucial to review Bitcoin’s past cycles, particularly the accumulation phases of 2019 and 2022. These periods offer valuable insights into how Bitcoin behaves after significant market corrections and before embarking on new bull runs.

The 2017 Peak and 2019 Accumulation:
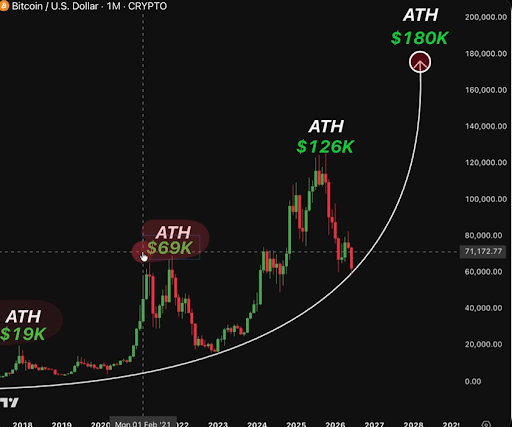
The first major cycle referenced began after Bitcoin’s monumental bull run in 2017, which saw its price surge from under $1,000 at the start of the year to nearly $19,000 by December. This period was marked by unprecedented retail interest, media hype, and widespread speculation. However, the subsequent bear market throughout 2018 was brutal, with Bitcoin’s price plummeting by over 83% from its peak, eventually bottoming out around $3,200 in December 2018. This steep decline erased much of the speculative gains and tested the conviction of even the most ardent supporters.
The year 2019 emerged as a critical accumulation phase. After the intense capitulation of late 2018, Bitcoin entered a prolonged period of consolidation. The price range, particularly in the first half of 2019, formed what is now retrospectively identified as a DCA zone. Sentiment was largely negative, with many declaring the "crypto bubble" burst. Trading volumes were thinner, and mainstream media interest had waned significantly. Yet, beneath the surface, savvy investors and long-term holders began to steadily accumulate, understanding the cyclical nature of market psychology. This period of quiet accumulation laid the groundwork for the impressive rally that eventually took Bitcoin to its 2021 all-time high of approximately $69,000. The journey from the 2019 lows to the 2021 peak represented a multi-fold increase, validating the strategy of accumulating during periods of extreme fear.
The 2021 Peak and 2022 Accumulation:
A similar, albeit shorter, structural pattern emerged following Bitcoin’s 2021 peak. After reaching nearly $69,000, Bitcoin experienced another significant downturn throughout 2022. This particular bear market was exacerbated by several high-profile collapses within the crypto ecosystem, most notably the implosion of the FTX exchange in November 2022. The FTX scandal sent shockwaves through the market, leading to widespread panic, forced liquidations, and a loss of confidence. Bitcoin’s price plummeted to around $15,500, representing another substantial drop from its peak.
The period immediately following the FTX collapse, stretching into early 2023, constituted another distinct DCA zone. Fear and uncertainty were rampant, with many questioning the long-term viability of the crypto industry. Regulatory scrutiny intensified, and institutional investors largely adopted a wait-and-see approach. However, for those with a long-term perspective, this period presented an unparalleled opportunity. Despite the overwhelming negative sentiment and the dire headlines, Bitcoin’s fundamental technology remained intact. Persistent accumulators who held through the crisis were ultimately rewarded. Following this accumulation phase, Bitcoin began a robust recovery, eventually reaching new highs above $126,000 by October 2025 (as projected by the original article’s timeline). This near 600% rally from the 2022 lows underscored the power of accumulating during periods of peak fear and market capitulation.
The Current Market Landscape: Bitcoin at $62,800
As of the time of analysis, Bitcoin is trading around $62,800, resting near the curved support line on its monthly chart, a technical indicator that has historically defined the lower boundaries of these accumulation zones. The crucial question facing investors and analysts is whether this support will hold, allowing the current cycle structure to mirror its bullish predecessors.
The current market environment is characterized by a complex interplay of forces. On one hand, the historical precedent of the DCA zone suggests a brewing opportunity for accumulation. On the other hand, several contemporary factors are exerting bearish pressure, creating a climate of uncertainty. One significant factor is the performance of Bitcoin Exchange-Traded Funds (ETFs). While the launch of spot Bitcoin ETFs in the U.S. earlier in the year was initially a major catalyst for price appreciation, recent weeks have seen a shift, with net outflows from these investment vehicles. These outflows indicate a potential cooling of institutional interest or profit-taking after the initial surge, adding downward pressure on Bitcoin’s price.

Furthermore, on-chain signals, which provide insights into the activity of network participants, are painting a mixed picture. The Realized Cap, a metric that represents the sum of all assets at their purchase price, has reportedly declined by approximately $12 billion from its mid-May peak. A decrease in Realized Cap can signify that coins are being sold at a loss or that new capital inflow is slowing down, often preceding periods of further price consolidation or decline. Another critical on-chain metric, the Bitcoin PnL (Profit and Loss) Index, which aggregates various profitability indicators, suggests that Bitcoin has yet to definitively reach a market bottom, although it is currently in a "transition phase." This indicates that while significant capitulation might have occurred, the market may not have fully flushed out all weak hands, suggesting further volatility could be ahead before a sustained recovery takes hold.
Macroeconomic Influences and Institutional Adoption
The broader macroeconomic environment plays a significant role in Bitcoin’s current valuation. Global inflation concerns, central bank monetary policies (particularly interest rate decisions by the U.S. Federal Reserve), and geopolitical uncertainties all contribute to a risk-off sentiment in traditional financial markets, which often spills over into riskier assets like cryptocurrencies. Higher interest rates, for instance, tend to make holding non-yield-bearing assets like Bitcoin less attractive compared to fixed-income investments. Conversely, a dovish shift in monetary policy could re-ignite appetite for growth assets.
Despite the recent ETF outflows, the long-term trend of institutional adoption remains a critical bullish narrative for Bitcoin. The very existence of spot Bitcoin ETFs has legitimized the asset for a broader range of institutional investors, pension funds, and wealth managers who previously faced regulatory or logistical hurdles. While short-term flows can be volatile, the infrastructure for institutional participation is now firmly in place, suggesting that future capital inflows could be substantial once market conditions become more favorable. Major financial institutions continue to explore and offer Bitcoin-related products, signaling a persistent, underlying demand from sophisticated investors who view Bitcoin as a strategic allocation in a diversified portfolio, perhaps as a hedge against inflation or a digital store of value.
Technical Indicators and On-Chain Analysis in Detail
Delving deeper into the technical and on-chain metrics provides a more nuanced understanding of Bitcoin’s current position.
Realized Cap: The Realized Cap is a crucial metric developed by Glassnode, representing the aggregate cost basis of all coins in circulation. Unlike market capitalization, which uses the current price, Realized Cap values each Bitcoin at the price it last moved on-chain. A declining Realized Cap, as observed with the $12 billion decrease from its mid-May peak, implies that a significant amount of capital has exited the Bitcoin network, either through sales at a loss or a lack of new investment. This phenomenon often accompanies bear markets or periods of consolidation, indicating that the market is shedding less convinced participants. For the DCA zone argument, a decline in Realized Cap can paradoxically be seen as a cleansing process, preparing the ground for a healthier, more organic recovery driven by conviction.
PnL Index (Profit and Loss Index): This composite index, which integrates various profitability metrics such as Net Unrealized Profit/Loss (NUPL), Realized Profit/Loss (RPL), and Market-Value-to-Realized-Value (MVRV) Z-Score, aims to identify periods of market euphoria, fear, and capitulation. The current signal indicating a "transition phase" suggests that while the market is no longer in extreme euphoria, it hasn’t yet reached the full capitulation typically associated with a definitive bottom. This aligns with the DCA zone argument that fear is elevated, but perhaps not yet at its absolute peak, meaning the accumulation phase could extend further or experience additional volatility. Historically, the deepest parts of accumulation zones have often coincided with the PnL Index signaling extreme fear or capitulation.
Market Psychology and the DCA Zone:
The fact that these bearish signals are emerging within the DCA zone strengthens the comparison with past cycles. The 2019 and 2022 accumulation phases were not characterized by calm market conditions or universal bullish sentiment. On the contrary, they occurred amidst thin liquidity, widespread FUD (fear, uncertainty, and doubt), and persistent expectations of further bottoms. Traders and investors were constantly on edge, anticipating deeper corrections. This psychological backdrop is precisely what makes a DCA zone effective: it encourages a disciplined approach during times when emotional trading would lead to poor decisions. The current confluence of a "DCA zone" with bearish on-chain metrics and negative ETF flows paints a picture consistent with these past periods of quiet accumulation preceding major rallies.
Implications and Future Outlook
The current juncture presents a critical test for Bitcoin. If the established DCA zone, marked by the curved support on the monthly chart, continues to hold, it would reinforce the historical cyclical pattern observed by analysts like Ardizor. This would imply that the market is indeed in an accumulation phase, preparing for another significant rally. Such an outcome would further solidify Bitcoin’s narrative as a resilient asset that undergoes periodic corrections before resuming its upward trajectory, attracting long-term conviction holders.
However, should Bitcoin fail to maintain this crucial support, it could signal a deeper correction. A break below the DCA zone would necessitate a re-evaluation of the current cycle’s structure and could lead to extended periods of consolidation at lower price points. This scenario, while painful for existing holders, might present even more attractive entry points for those with a long-term investment horizon.
The broader implications extend beyond just price movements. Bitcoin’s ability to navigate these periods of high fear and emerge stronger reinforces its role as a decentralized, censorship-resistant digital asset. As global economic uncertainties persist and trust in traditional financial systems faces scrutiny, the appeal of a scarce, immutable asset like Bitcoin could grow. The increasing maturity of the market, evidenced by the growth of institutional products like ETFs, suggests that future cycles may be influenced by a more diverse set of participants, from individual retail investors to large sovereign wealth funds. The current DCA zone, therefore, is not merely a technical price level but a testament to the ongoing evolution of Bitcoin as a global financial asset, continuously testing and proving its resilience in the face of market volatility and shifting sentiment. The coming months will be crucial in determining whether history will indeed rhyme for Bitcoin’s next major move.