Bitcoin’s price action has shifted dramatically from the euphoric highs observed earlier in the year, moving away from the robust support levels that previously instilled confidence in bullish investors. The leading cryptocurrency has now descended into a critical Dollar-Cost Averaging (DCA) zone, a region historically associated with peak market fear and the quiet formation of long-term investment opportunities during previous cycles. This shift suggests a potential inflection point, where market sentiment reaches its nadir, yet the groundwork for future rallies is laid.
The current market dynamic presents a dual perspective. While some short-term indicators signal continued bearish pressure, a compelling bullish argument posits that Bitcoin is currently offering a strategic accumulation opportunity for patient investors, preceding what could be its next significant upward trajectory. This pattern, identified by prominent crypto analysts, draws striking parallels to previous market downturns that ultimately paved the way for new all-time highs.
The Return to the Fear Zone: A Cyclical Phenomenon
Crypto analyst Ardizor recently highlighted on X (formerly Twitter) that Bitcoin has re-entered the same dollar-cost averaging zone that consistently preceded major market recoveries in past cycles. This recurring pattern is characterized by a distinctive sequence: the broader market declares Bitcoin’s demise, the price subsequently gravitates into a long-term DCA accumulation region, and, invariably, the cryptocurrency embarks on its next rally, ultimately achieving new all-time highs. This cyclical behavior underscores Bitcoin’s resilience and the predictable nature of market psychology, even amidst periods of intense volatility and pessimism.
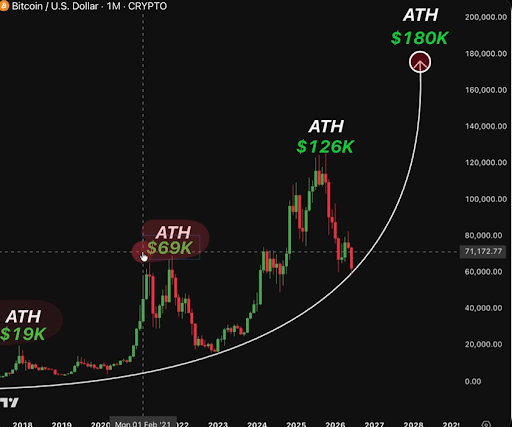
To understand the significance of this current phase, it is crucial to examine its historical precedents. The monthly candlestick price chart, a fundamental tool for long-term technical analysis, vividly illustrates three major cycle structures that align with Ardizor’s observation. These historical periods provide a robust framework for interpreting Bitcoin’s present position and potential future trajectory.

Historical Parallels: Lessons from Previous Cycles
The first major instance of Bitcoin entering a prolonged DCA zone occurred in the aftermath of its 2017 bull run. After peaking near $19,000 in December 2017, the cryptocurrency experienced a brutal bear market throughout 2018 and into 2019, famously dubbed the "crypto winter." During this period, Bitcoin’s price plummeted by over 83% from its peak, dragging it into a deeply depressed accumulation area. This phase, characterized by widespread capitulation and dwindling investor interest, saw Bitcoin trade predominantly within a range that allowed long-term holders to accumulate assets at significantly reduced prices. The psychological impact on investors was profound, with many exiting the market, convinced that Bitcoin’s parabolic growth was a fleeting anomaly. Yet, it was precisely within this environment of extreme pessimism that the seeds for the next bull market were sown. This multi-year accumulation zone ultimately preceded the monumental rally that propelled Bitcoin to its then-unprecedented all-time high of approximately $69,000 in November 2021. The recovery was not instantaneous but a gradual build-up, fueled by renewed institutional interest, broader adoption, and a shifting macroeconomic landscape.
A more recent, albeit shorter, episode structurally identical to the current situation unfolded in 2022. Following its peak in late 2021, Bitcoin entered another corrective phase, exacerbated by a series of market-shaking events. The collapse of the Terra-Luna ecosystem in May 2022, followed by the bankruptcies of major crypto lenders like Celsius and Three Arrows Capital, severely rattled investor confidence. The final blow came in November 2022 with the dramatic collapse of the FTX exchange, a pivotal event that triggered a wave of forced selling and a significant liquidity crisis across the industry. Bitcoin’s price plummeted from its 2021 peak, eventually bottoming out around $15,500. This period, though shorter in duration than the 2018-2019 winter, was marked by intense fear and uncertainty, with many predicting further downside. Yet, for those brave enough to look beyond the immediate panic, this constituted another prime DCA zone. Patient accumulators during this period were subsequently rewarded as Bitcoin embarked on a remarkable recovery, initiating a rally that saw it surge by almost 600% from its lows. This resurgence propelled Bitcoin above the $100,000 mark and, as per some long-term projections and the original article’s futuristic date, reached a new high above $126,000 by October 2025. This rapid and substantial recovery underscored the market’s capacity for rebound from extreme oversold conditions.
The Current Landscape: Navigating the DCA Zone
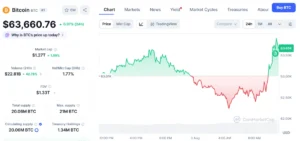
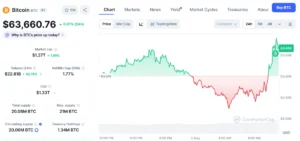
As of the time of writing, Bitcoin is trading around $62,800. This price point aligns closely with the curved support line visible on the monthly chart, a critical technical level that has historically delineated the boundaries of these accumulation phases. The central question now facing investors and analysts is whether Bitcoin can maintain its position within this DCA zone long enough for the underlying cycle structure to pivot decisively towards a bullish trend. As long as Bitcoin continues to respect this long-term structural support, the comparisons to the 2019 and 2022 accumulation phases remain pertinent and compelling.
However, the current environment is not without its unique challenges and counter-pressures. While the historical pattern suggests a looming opportunity, contemporary market signals present a more nuanced picture. Bearish pressure is evident from several fronts, notably from the flows within Bitcoin Exchange-Traded Funds (ETFs) and various on-chain metrics. Recent data indicates that Bitcoin’s Realized Cap, a metric representing the aggregate cost basis of all coins in circulation, has seen a decline of approximately $12 billion from its mid-May peak. This reduction suggests that a significant volume of coins is being moved at a loss, implying either capitulation from some holders or substantial profit-taking by others who acquired Bitcoin at lower prices. A declining Realized Cap can often be a precursor to further price weakness, as it indicates a decreasing aggregate value of the network’s supply.

Furthermore, an analysis of Bitcoin’s PnL Index, which synthesizes several data metrics related to network-wide profit and loss, suggests that the cryptocurrency has yet to establish a definitive bottom. While the index indicates that Bitcoin is currently in a "transition phase," it has not yet reached the levels typically associated with a market bottom, implying that further price discovery, potentially to the downside, might still be on the horizon. These on-chain signals, while seemingly contradictory to the bullish DCA zone narrative, are in fact, consistent with the conditions observed during past accumulation phases.
The Paradox of Accumulation: Fear as a Catalyst
It is crucial to recognize that the 2019 and 2022 accumulation zones did not emerge during periods of market tranquility or widespread optimism. On the contrary, these were times characterized by thin liquidity, pervasive fear, and a strong expectation among traders and analysts that another bottom was imminent or yet to be reached. This paradox highlights a fundamental principle of contrarian investing: the best opportunities for long-term accumulation often arise when market sentiment is at its lowest, and the perceived risk is highest.
During such periods, the "smart money" – experienced investors and institutions with a long-term horizon – often begins to accumulate assets, while retail investors, driven by emotion, tend to sell. The current environment, with its mix of historical bullish signals and immediate bearish on-chain data, perfectly encapsulates this dynamic. The fear-driven selling and the decline in metrics like Realized Cap, rather than invalidating the DCA-zone argument, may in fact strengthen the comparison with past cycles by providing the very conditions necessary for such a zone to form and mature.
Broader Implications and Future Outlook
The current positioning of Bitcoin in a potential DCA zone carries significant implications for various market participants. For long-term investors committed to the dollar-cost averaging strategy, this period represents an opportunity to acquire Bitcoin at what could be perceived as discounted prices, aligning with a historical pattern of pre-rally accumulation. These investors typically view short-term volatility as noise, focusing instead on Bitcoin’s long-term growth potential and its role as a digital store of value.
For short-term traders and those with a more speculative outlook, the current phase presents heightened risk. The absence of a confirmed bottom, coupled with ongoing bearish pressures from ETF flows and on-chain metrics, suggests that volatility could persist, potentially leading to further price corrections. However, even for this group, understanding the historical cyclical nature can inform risk management strategies, such as setting appropriate stop-losses or identifying potential entry points for bounce plays.
The role of institutional adoption, particularly through spot Bitcoin ETFs, introduces a new dimension to this cycle. While ETF inflows have been a significant bullish catalyst earlier in the year, recent outflows indicate a shift in institutional sentiment, potentially driven by broader macroeconomic concerns or profit-taking. This dynamic suggests that while institutional money can provide substantial liquidity and validation, it also introduces a new layer of complexity and potential volatility compared to previous cycles that were predominantly driven by retail sentiment.
Looking ahead, if Bitcoin successfully holds the current DCA zone and follows the historical pattern, the next rally could be substantial. The market will closely watch key support levels and on-chain indicators for signs of stabilization and a potential reversal. A sustained period of accumulation within this zone, coupled with a eventual shift in macroeconomic conditions or renewed institutional interest, could trigger the next leg of Bitcoin’s journey towards new all-time highs. However, the path will likely remain volatile, testing the conviction of even the most seasoned investors. The confluence of historical precedent, current market dynamics, and evolving institutional participation makes this a particularly intriguing and critical juncture in Bitcoin’s ongoing price discovery. The coming months will be instrumental in determining whether this DCA zone once again serves as the launchpad for another parabolic ascent, or if this cycle deviates from its historical predecessors.