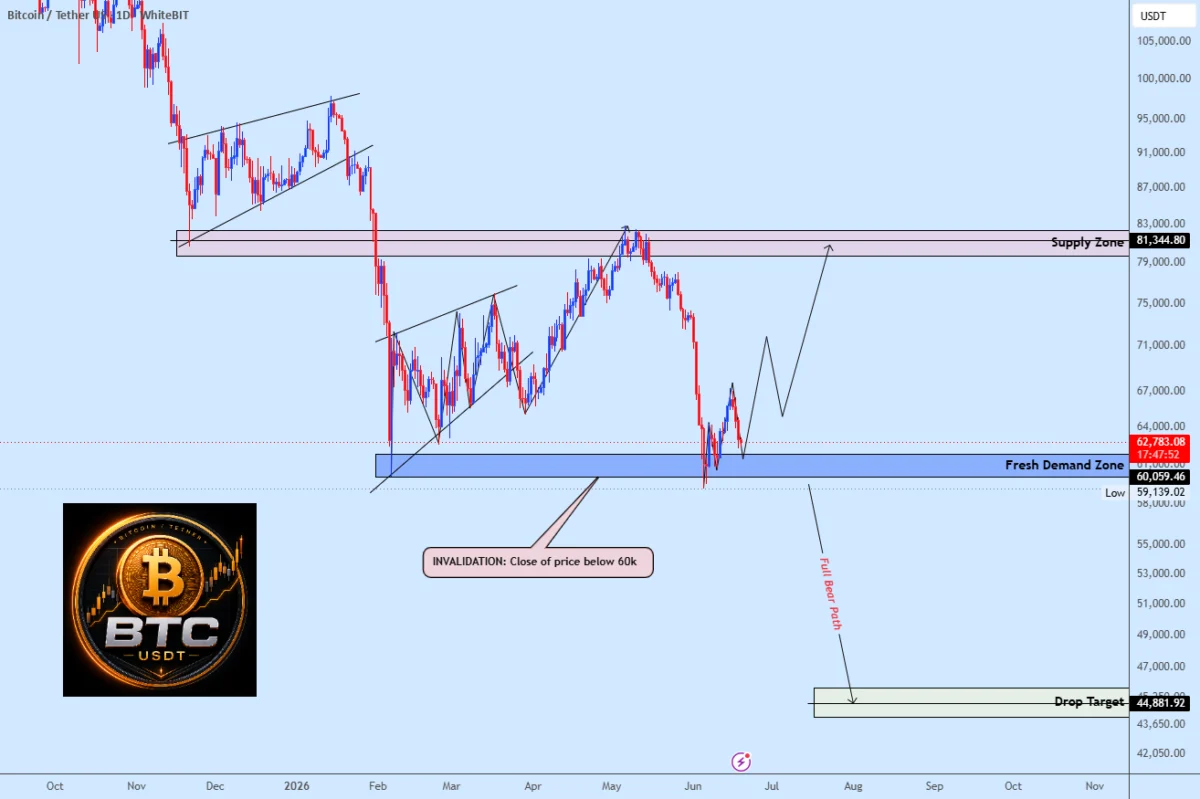
Bitcoin is currently navigating a pivotal juncture in its market trajectory, with the $60,000 psychological threshold serving as the primary battleground for bulls and bears alike. As the asset fluctuates near this technical support zone, market analysts and institutional observers are closely monitoring price action to determine whether the recent consolidation phase represents a temporary exhaustion of selling pressure or the precursor to a more significant downward correction. In a June 20 analysis shared on the TradingView platform, market observer weslad highlighted that the current price range of BTCUSDT has entered a critical demand zone. This area is characterized by historical buyer activity, acting as a structural floor that, if breached, could fundamentally alter the short-term bullish outlook for the cryptocurrency.
The Technical Significance of the $60,000 Threshold
The $60,000 level is widely recognized by technical analysts as a "line in the sand." Beyond the simple allure of a round number, this price point corresponds with significant volume profiles established during previous market cycles. From a technical perspective, a demand zone is a price range where buy orders have historically outweighed sell orders, creating a cluster of liquidity that prevents further downward movement.
The current analysis suggests that as long as Bitcoin maintains its position within this demand zone, the potential for a recovery toward the $81,000 supply area remains a viable scenario. This upside target is identified as the origin of the recent decline, representing a potential liquidity grab—a phenomenon where the market sweeps through stop-loss orders to gather the necessary momentum for a reversal. However, the viability of this recovery is contingent upon sustained buying pressure. If the market fails to defend the $60,000 level, the technical damage to the bullish structure could be extensive, likely triggering a cascade of stop-loss liquidations that would shift the market sentiment from cautious optimism to a more defensive, risk-off posture.
Chronology of Recent Market Movements
To understand the current state of Bitcoin, it is necessary to examine the events that have led the asset to this critical juncture. Following the peak of the latest bullish cycle, Bitcoin experienced a period of volatility characterized by macro-economic pressures, including shifts in central bank interest rate policies and fluctuating demand for spot Bitcoin exchange-traded funds (ETFs) in the United States.

In early 2024, the anticipation of the Bitcoin halving event drove prices toward record highs, with many institutional investors entering the market through regulated financial products. However, the post-halving period has been marked by a cooling-off phase. Throughout late spring and early summer, Bitcoin struggled to maintain its momentum above the $70,000 mark. By mid-June, a series of negative sentiment shifts—driven by concerns over global liquidity and potential regulatory scrutiny—pushed the asset toward the $60,000 support level. This sequence of events has effectively compressed the market into the current, high-stakes consolidation pattern, where every daily close near this support level provides critical data for institutional traders and retail participants.
Supporting Data and Market Dynamics
The current market environment is supported by several key metrics that provide context for the struggle at the $60,000 level. Data from on-chain analytics platforms indicate that while exchange inflows have remained moderate, the volume of Bitcoin held in "cold storage" by long-term holders (LTHs) has remained relatively stable, suggesting that many participants are choosing to hold through the volatility rather than liquidate at a loss.
However, the derivative markets tell a different story. The open interest (OI) in Bitcoin futures has remained high, indicating a high level of leverage in the market. When prices hover near critical support levels like $60,000, high OI increases the risk of "long squeezes." A long squeeze occurs when the price drops below a key support level, forcing leveraged traders to sell their positions to avoid further losses, which in turn drives the price lower. Analysts observing the current setup emphasize that a lack of volume on the downside could be a positive signal, implying that sellers are not aggressively pushing the price through the support zone, but rather that buyers are simply waiting for a clearer trend before committing fresh capital.
Implications of a Potential Breakdown
A decisive close below $60,000 would carry significant implications for the broader cryptocurrency market. Historically, when Bitcoin breaks a major support level, the resulting volatility tends to correlate with broader equity market drawdowns, particularly in technology-heavy indices.
The primary danger of a breakdown is the "sentiment shift." Market sentiment is highly reflexive in the crypto sector; if the $60,000 level fails, the narrative surrounding the current market cycle would likely transition from a "bull market correction" to a "prolonged distribution phase." This would necessitate a reassessment of price targets for the remainder of the year. Investors would likely look to secondary support levels, such as the $52,000 and $48,000 zones, which have historically served as entry points for institutional accumulation. Conversely, a successful defense of the $60,000 zone would reinforce the "buy-the-dip" mentality that has been a hallmark of Bitcoin’s performance over the last decade, potentially paving the way for a test of resistance levels near $72,000 before an attempt at the $81,000 target.

Institutional and Regulatory Context
The current price action is also playing out against a backdrop of evolving regulatory and institutional involvement. The approval of spot Bitcoin ETFs has integrated the asset into traditional finance to an unprecedented degree. As a result, the behavior of Bitcoin is increasingly influenced by the "trading hours" of traditional markets. Reactions from institutional players—such as major asset management firms and pension funds—are becoming more predictable; they often treat $60,000 as a value-based entry point.
Official commentary from industry experts frequently highlights that the volatility seen around these levels is often a byproduct of the "price discovery" process. As Bitcoin matures, its sensitivity to macroeconomic indicators such as the Consumer Price Index (CPI) and Federal Reserve interest rate announcements has grown. The current struggle at $60,000 is not happening in a vacuum; it is being influenced by a market that is simultaneously trying to price in the future of monetary policy while dealing with the inherent technical volatility of a digital asset class.
Conclusion: The Binary Nature of the Current Setup
The current setup for Bitcoin is best characterized as a binary test. Market participants are essentially waiting for the market to declare its intent. There is no middle ground in this technical analysis: either the $60,000 zone will act as the foundation for a renewed rally toward the $81,000 supply area, or it will be identified as the point where the momentum of the current cycle exhausted itself.
For investors, the coming days will be vital. A close above the support level, accompanied by an increase in spot buying volume, would be a strong indicator that the market is ready to resume its upward trajectory. On the other hand, a breach of this level, particularly if accompanied by high selling volume, would suggest that a deeper correction is necessary to flush out excess leverage and reset the market’s risk profile. As the digital asset market continues to mature, the focus remains on whether Bitcoin can maintain its role as a stable store of value amidst the noise of short-term technical testing. Traders and analysts alike remain vigilant, recognizing that the resolution of this test will likely set the tone for the market’s performance for the remainder of the quarter. While the chart provides a clear path forward, the actual realization of these targets will depend on the collective behavior of a diverse global market that is increasingly sensitive to the interplay between technical support and macro-financial reality.