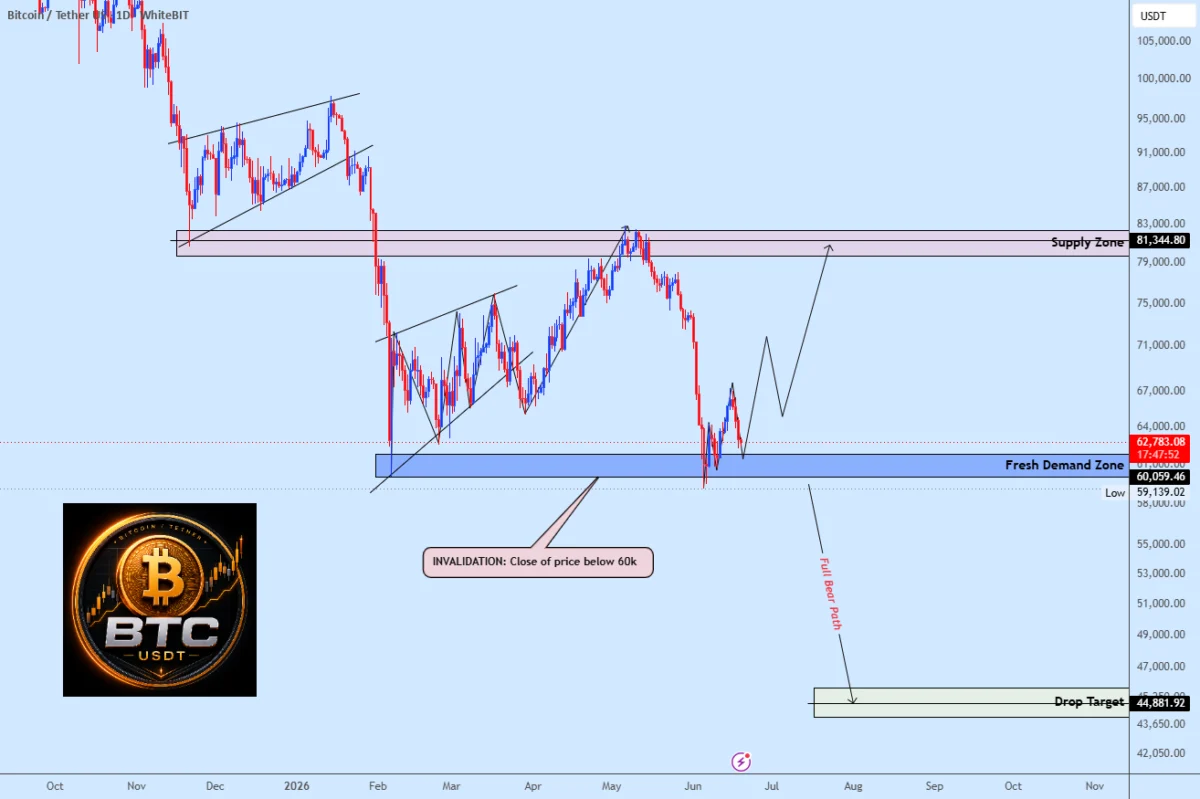
Bitcoin has returned to a pivotal juncture, resting at the psychologically and technically significant $60,000 threshold. This price point, long regarded as a primary battlefield between institutional accumulation and retail-driven liquidations, is currently being scrutinized by market participants and technical analysts alike. According to recent market analysis, including a June 20 observation by the analyst known as weslad on TradingView, the current demand zone serves as a fundamental determinant for the asset’s immediate future. The analysis posits that while buyers have begun to defend this territory, the market cannot afford a decisive breach of this level without triggering a more profound structural breakdown.
Chronology of the Current Market Correction
To understand the gravity of the $60,000 test, one must look at the preceding months of price action. Following the peak of early 2024, Bitcoin entered a period of consolidation characterized by high volatility. Throughout the spring, the cryptocurrency saw attempts to establish new highs, yet it repeatedly faced resistance at the $70,000 to $73,000 range. The subsequent pullback was not merely a function of profit-taking but also a reaction to shifting macroeconomic expectations, specifically regarding the United States Federal Reserve’s interest rate policy and the cooling of inflation data.
As the price drifted downward through May and early June, the $60,000 mark became the focal point for traders. Historically, this level has acted as both a massive resistance barrier during the 2021 bull cycle and a robust support floor during the late 2023 accumulation phase. The current struggle is indicative of a market searching for its next catalyst—be it the continued inflow into spot Bitcoin ETFs, changes in global liquidity, or the broader sentiment surrounding the halving cycle that occurred in April.
Technical Significance and Liquidity Dynamics
The technical importance of the $60,000 level extends beyond simple round-number psychology. In technical analysis, a demand zone is defined by a cluster of buy orders that have previously absorbed excess supply. When price re-enters this zone, institutional algorithms often look for signals of exhaustion among sellers.
The analysis provided by weslad highlights that as long as Bitcoin maintains this demand zone, the potential for a recovery toward the $81,000 supply area remains a viable upside target. This $81,000 level is widely identified as the origin point of the recent major decline, serving as a liquidity pool where stop-loss orders from short sellers are likely clustered. If buyers can defend the $60,000 floor, they effectively invalidate the bearish thesis, potentially triggering a short squeeze that could propel the price back toward historical highs.

However, the inverse scenario presents a significant risk. Markets operate on the principle of self-fulfilling prophecies regarding support levels. If a large number of market participants are watching the same support line, a failure to hold that line often triggers a cascade of stop-loss orders. These forced liquidations can exacerbate a sell-off, turning a technical retracement into a deeper, sentiment-driven correction. A decisive close below $60,000 would likely force traders to reconsider their bullish exposure, potentially shifting the market into a "risk-off" regime.
Macroeconomic Factors and Institutional Context
The current market environment for Bitcoin is inextricably linked to broader economic indicators. The influence of institutional investors, particularly those managing spot Bitcoin ETFs, has added a layer of complexity to price action. Unlike the retail-driven markets of the past, the current Bitcoin ecosystem is heavily influenced by the flow of capital into regulated financial products.
Recent data shows that net inflows into these ETFs have fluctuated, often tracking with the broader stock market’s performance. When investors feel uncertainty regarding the strength of the economy, Bitcoin is frequently treated as a "risk-on" asset, leading to a correlation with tech stocks and the Nasdaq. Consequently, when the S&P 500 or the Nasdaq experience turbulence, Bitcoin often feels the pressure, leading to the testing of support levels like $60,000.
Furthermore, the "liquidity" mentioned by market analysts refers to the availability of capital and the ease with which large orders can be executed without drastically moving the price. Currently, the market is exhibiting signs of reduced liquidity, which can lead to "wicking" or rapid, exaggerated price movements. This underscores why the $60,000 support is not just a line on a chart, but a critical gatekeeper for market stability.
The Case for Recovery: Requirements for Bulls
For the bullish scenario to materialize, Bitcoin must do more than simply bounce off $60,000. Analysts argue that a "defensive reaction" is insufficient; a "trend reversal" requires a reclaim of nearby resistance levels. This involves high-volume buying that breaks through the immediate supply walls formed during the recent descent.
The primary hurdle for the bulls is to demonstrate that the demand at $60,000 is not merely a temporary pause, but a structural floor. This requires a sustained period of consolidation above this level, followed by an impulsive move upward that breaks the short-term downtrend line. Only then can the target of $81,000 be considered a realistic short-term objective.

Conversely, the market must contend with the reality of negative sentiment. If the recovery is sluggish or if every attempt to rally is met with immediate selling pressure, the likelihood of a "re-test" of the lows increases. In the financial world, support levels that are tested too frequently tend to weaken, making a breakdown more probable over time.
Broader Implications and Market Outlook
The implications of a breach below $60,000 are profound. A drop into the $50,000 range would not only negate the progress made in the first half of the year but would also likely force a change in the strategic positioning of long-term holders. While many retail investors may panic, institutional entities often view deeper corrections as buying opportunities, provided the underlying thesis of Bitcoin as a hedge against currency debasement remains intact.
Industry experts remain divided on the short-term path. Some argue that the market is currently in a "washout" phase, designed to purge over-leveraged traders before the next leg of the bull market begins. Others express caution, citing the lack of a clear macroeconomic catalyst to drive a major breakout.
In conclusion, the situation regarding Bitcoin at $60,000 represents a classic binary outcome. Traders and investors are observing the market with heightened focus, waiting for a definitive signal. The ability of the asset to hold this zone will likely define the price action for the coming quarter. As the market stands at this crossroads, the emphasis remains on price discipline, risk management, and the observation of volume patterns that will ultimately confirm whether the $60,000 level acts as a launchpad for future gains or the threshold of a broader market correction.
Summary of Key Considerations
- Psychological Threshold: $60,000 serves as the primary battleground for market sentiment, dictating whether investors remain confident in the long-term bull trend.
- Support Integrity: A failure to hold the $60,000 zone risks triggering stop-loss cascades, which could lead to a deeper and more prolonged decline.
- Upside Potential: Maintaining support at this level keeps the $81,000 target in focus, potentially initiating a recovery that could test previous liquidity pools.
- Institutional Influence: ETF flows and broader macroeconomic correlations remain the primary drivers of volatility, requiring traders to look beyond crypto-native data and consider global financial trends.
- Technical Confirmation: A sustained reversal requires not just a bounce, but a series of higher highs that demonstrate a shift in supply-demand equilibrium.
As with any highly volatile asset class, the path forward for Bitcoin remains uncertain. The coming days will be critical in determining whether the bulls can consolidate their position or if the bears will seize control of the narrative. Market participants are advised to monitor volume, exchange inflows, and broader macroeconomic reports to better gauge the validity of the current price action. Whether the market chooses to hold or break, the events unfolding at the $60,000 level will undoubtedly be cited as a seminal moment in the 2025-2026 market cycle.