
The landscape of the cryptocurrency market has undergone a significant transformation, with Bitcoin (BTC) departing from the euphoric highs that defined the earlier stages of the current cycle. As price action cools, the leading digital asset has entered what market analysts identify as a "Dollar-Cost Averaging" (DCA) zone—a technical region historically associated with periods of extreme investor pessimism and the quiet formation of long-term value. This shift, while concerning to short-term speculators, is being viewed by institutional analysts and seasoned market observers as a structural echo of previous cycle bottoms.
Historical Context and Cycle Symmetry
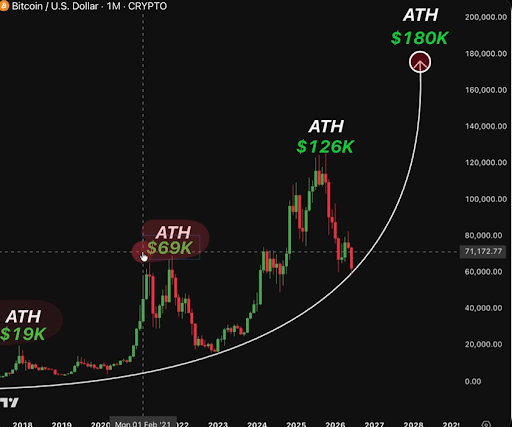
To understand the significance of Bitcoin’s current price positioning, it is necessary to examine the historical precedents of 2019 and 2022. In 2019, following the collapse of the 2017 bull market that saw BTC peak near $19,000, the asset entered a prolonged, depressed phase characterized by an 83% drawdown. This period of stagnation was not a sign of the asset’s demise, but rather the foundation for the subsequent rally that propelled Bitcoin to $69,000 in 2021.
A similar, albeit more condensed, phenomenon occurred in late 2022. The exogenous shock caused by the collapse of the FTX exchange triggered a wave of forced liquidations, driving Bitcoin to a cycle low of approximately $15,500. During this time, market sentiment reached a nadir, with mainstream media frequently declaring the "death" of Bitcoin. Yet, those who utilized the DCA strategy during that window of maximum fear were positioned to capitalize on the subsequent 600% rally, which culminated in a new all-time high of over $126,000 in October 2025.

Analyzing the Current Technical Landscape
As of the latest market data, Bitcoin is oscillating around the $62,800 level. Technical analysis of the monthly timeframe reveals that the price is currently testing a curved support structure that aligns with the accumulation phases observed in previous years. Crypto analyst Ardizor recently highlighted this correlation on social media, emphasizing that the current market behavior mirrors the "disbelief" phase that typically precedes a major trend reversal.
The structural similarity between these periods is striking. In each instance, the market experienced a period where volatility compressed, and retail interest waned, allowing long-term investors to consolidate their positions. The current movement suggests that Bitcoin is once again in a transition phase, moving from a speculative asset class to one defined by institutional holding and systematic accumulation.
Supporting Data and On-Chain Metrics
While the technical charts suggest a period of accumulation, fundamental on-chain data provides a more nuanced view of the current liquidity environment. Recent data from blockchain analytics firms indicate that Bitcoin’s Realized Cap—a metric that measures the total value of all coins at the price they were last moved—has declined by approximately $12 billion from its mid-May peak. This reduction serves as a proxy for capital flight and profit-taking by short-term holders.
Furthermore, the Bitcoin Profit and Loss (PnL) Index suggests that while the market is not yet at an absolute bottom, it is deep within a transition zone. The PnL Index, which aggregates various on-chain indicators to determine the profitability of the network, remains in a state of flux. This indicates that while the "capitulation" phase—where weak hands exit the market—may be nearing completion, the market has not yet established the firm support necessary for a sustained breakout.

Institutional Influence and ETF Flows
The behavior of institutional investors, particularly those managing Bitcoin Exchange-Traded Funds (ETFs), has introduced a new layer of complexity to the market. Unlike previous cycles, which were largely driven by retail speculation, the current cycle is influenced by a diverse array of institutional participants.
Recent ETF flow data indicates a mixed response to current price levels. While some institutional portfolios have increased their exposure, taking advantage of the "discount" relative to recent highs, others have adopted a risk-off posture, awaiting clearer signals from macroeconomic indicators such as Federal Reserve interest rate policies and global liquidity trends. This institutional tug-of-war is precisely what creates the current DCA zone; it is a tug-of-war between those liquidating for risk management and those accumulating for long-term appreciation.
Broader Implications for the Cryptocurrency Market
The implications of this cycle are twofold. On one hand, the persistent volatility and the failure to hold previous support levels may deter short-term traders. On the other hand, the durability of the $60,000 support level suggests a robust floor that did not exist in previous iterations of the market.
If the historical pattern holds, the current phase serves a critical function: the redistribution of coins from short-term speculators to long-term "HODLers." This redistribution is a prerequisite for any healthy bull market. When the "noise" of the market subsides and the fear of a deeper drop dissipates, the supply-demand imbalance typically shifts, leading to the next expansionary phase.
Expert Perspectives and Market Outlook
Market observers remain divided on the duration of this accumulation phase. Some analysts argue that with the increasing integration of Bitcoin into traditional finance, the time required to reach a bottom may be shorter than in previous, less mature cycles. Others contend that the influence of macroeconomic headwinds—including inflationary pressures and geopolitical instability—may keep Bitcoin in this range for several months.
"The current market environment is a classic test of conviction," noted a lead market strategist at a major digital asset firm. "While on-chain data shows a decline in realized value, it also reveals a significant increase in the age of dormant coins, indicating that the ‘smart money’ is not selling; it is accumulating."
Conclusion: Navigating the Transition
As Bitcoin continues to navigate this consolidation period, investors are urged to distinguish between short-term price volatility and long-term structural trends. The data suggests that we are currently in the "accumulation" phase of the cycle, a period characterized by uncertainty but also by historical opportunity.
Whether Bitcoin remains in this range or experiences further testing of lower support levels, the overarching theme remains one of cyclical maturation. The transition from the post-rally euphoria of 2025 to the current accumulation phase is a natural part of the lifecycle of a digital asset class that is becoming increasingly institutionalized. For those observing the market through a long-term lens, the current DCA zone represents a strategic window, echoing the patterns that have defined the cryptocurrency’s growth over the past decade. The key for market participants will be maintaining perspective as the market works through the current liquidity contraction, keeping a close watch on both technical support levels and the shifting flow of institutional capital.