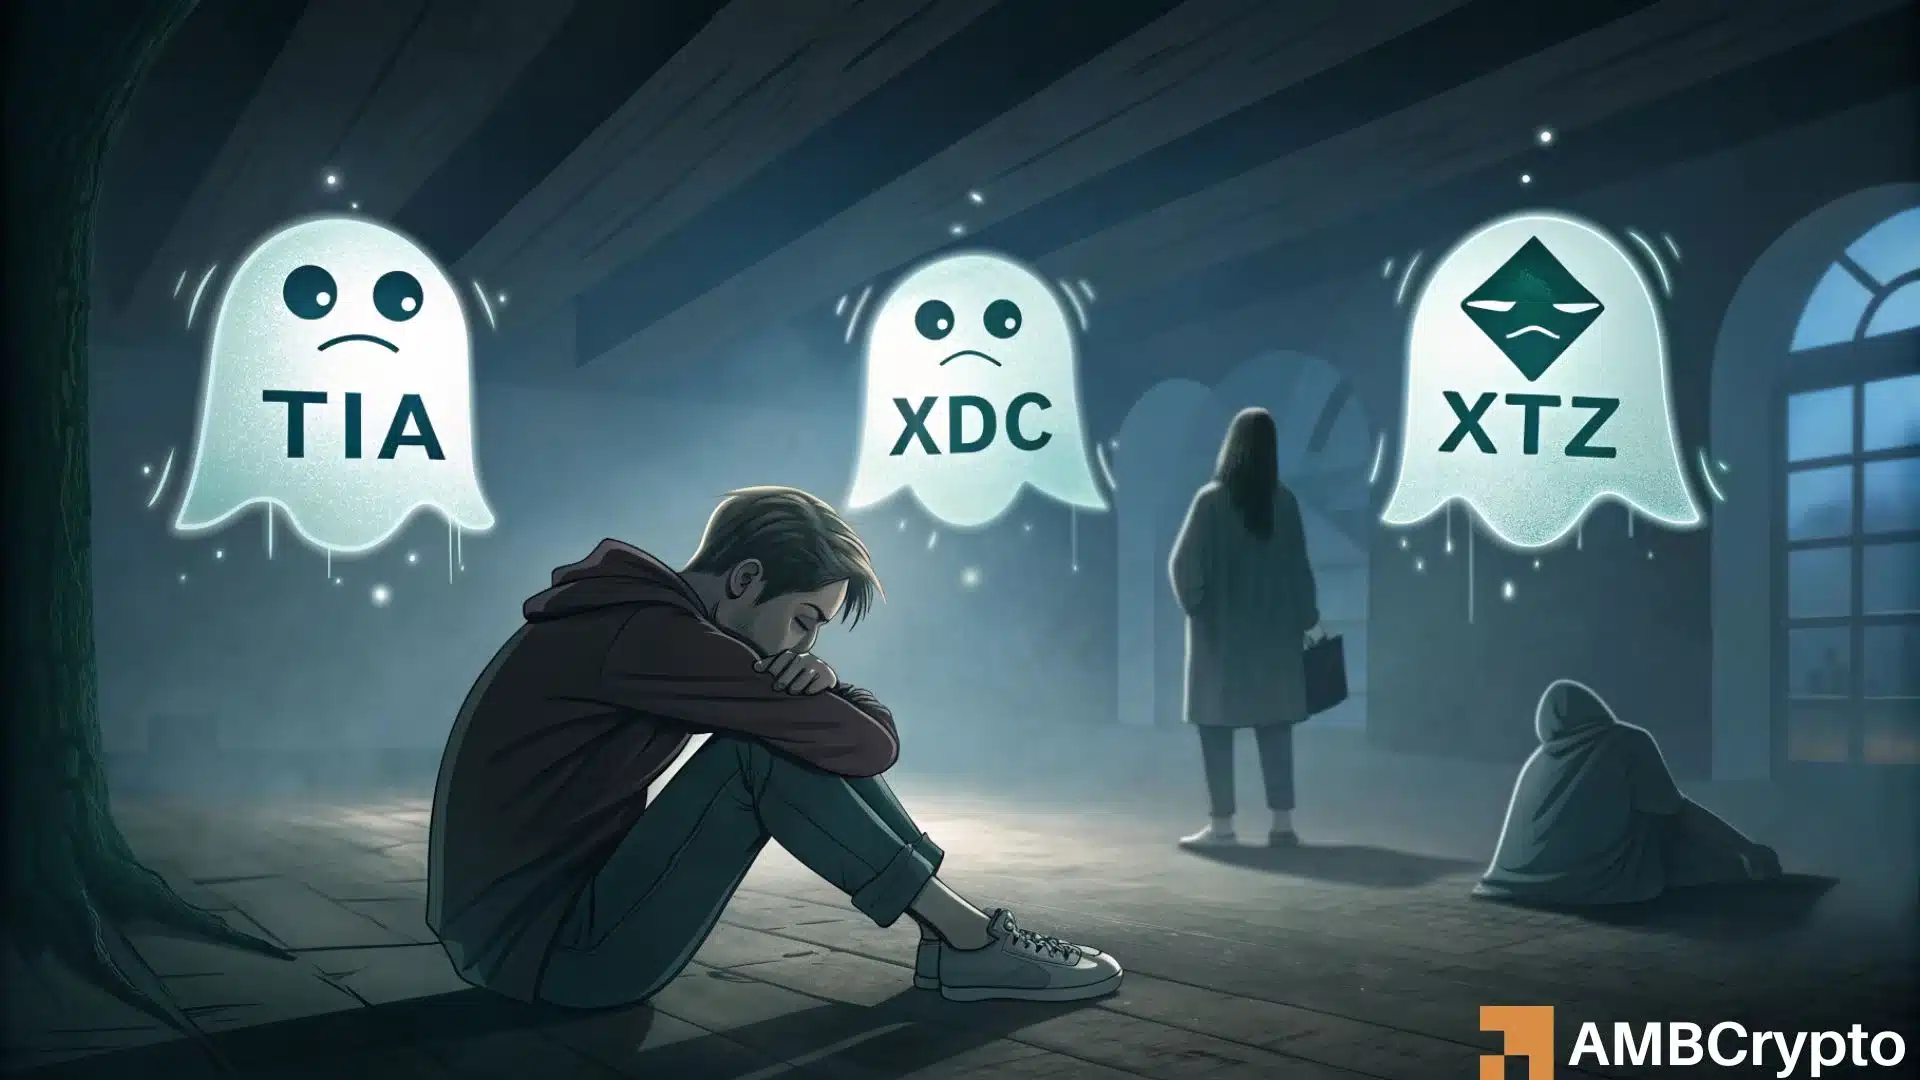
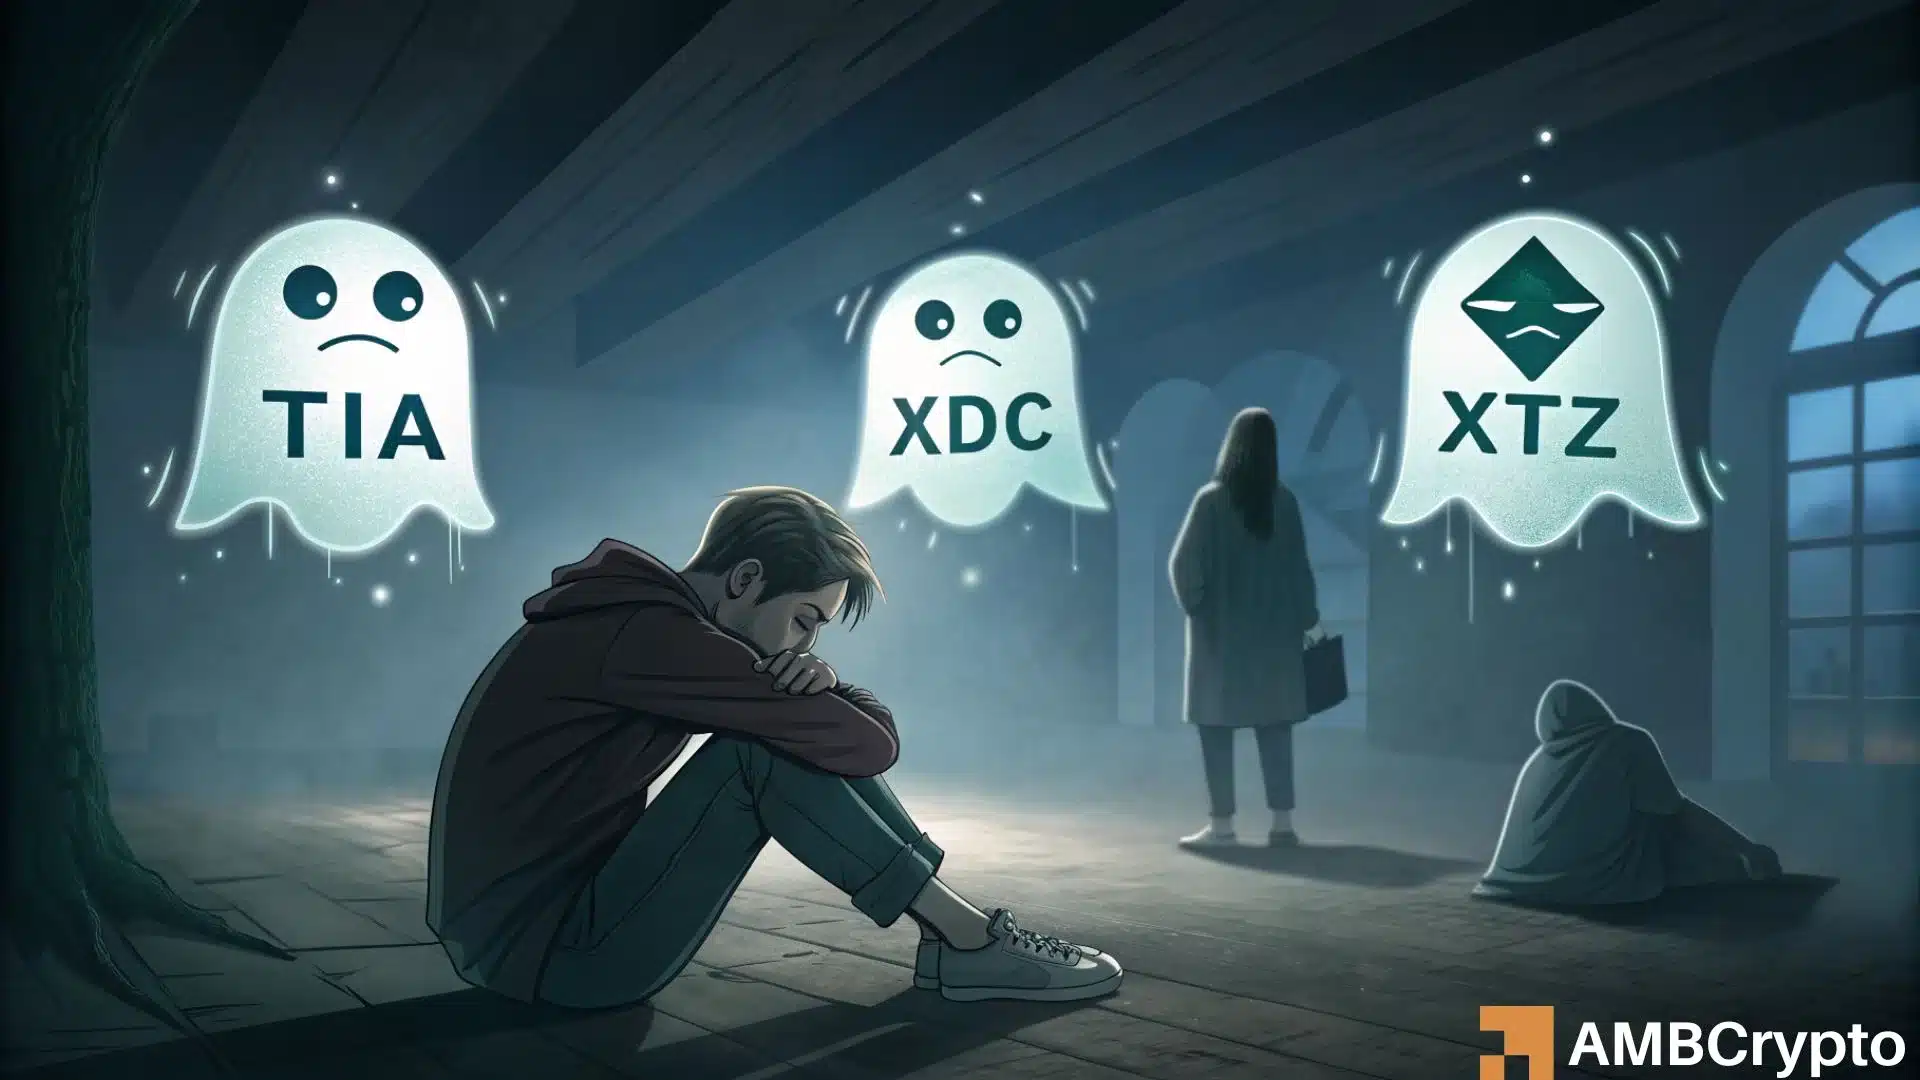
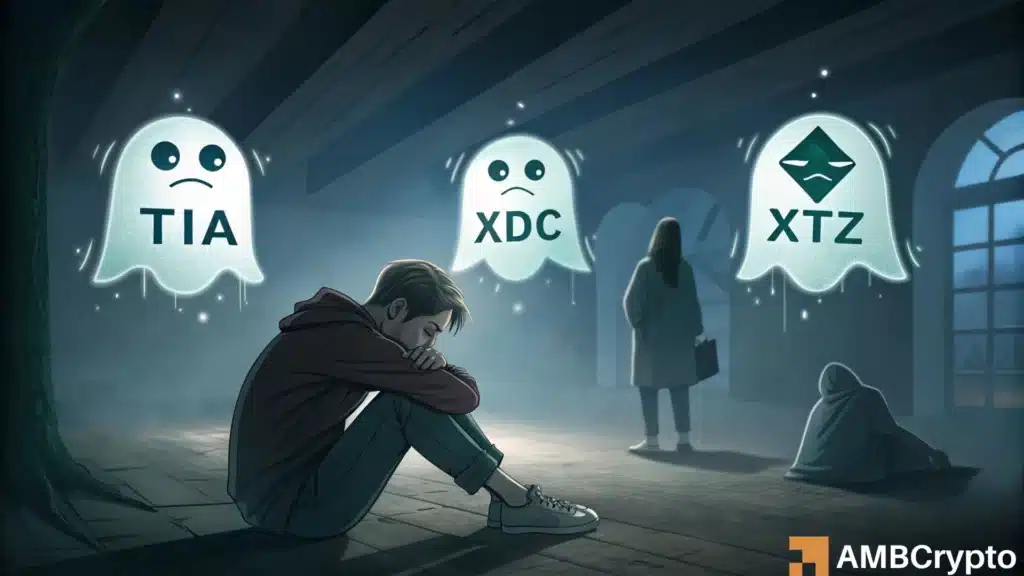
The rapid expansion of the decentralized finance (DeFi) ecosystem has led to a proliferation of blockchain networks, with platforms like DefiLlama now tracking more than 500 distinct chains. This explosion in infrastructure was once viewed as a sign of industry maturation; however, current data suggests a widening gap between speculative market valuation and tangible network utility. While Alchemy reports that at least 64 of these chains maintain a significant market capitalization, a growing number of these networks are exhibiting signs of "ghost town" syndrome, where high valuations persist despite a precipitous decline in active users and on-chain transaction volume. This disconnect raises fundamental questions regarding the sustainability of project valuations that are decoupled from actual network participation.
The Divergence of Price and Participation
In the traditional financial sector, an asset’s valuation is often tethered to its cash flow or utility. In the blockchain sector, however, market capitalization—the total value of all circulating tokens—often reflects speculative sentiment rather than operational success. The recent performance of several prominent networks provides a stark illustration of this phenomenon.
For instance, the XDC Network, once a darling of the enterprise-grade blockchain space, has witnessed its market capitalization fluctuate significantly, currently hovering around $644 million despite a previous peak of $2 billion. More concerning than the price volatility is the underlying usage data. According to Token Terminal, the network’s daily active addresses plummeted from a 2021 peak of approximately 288,000 to just 16,000 in early 2026. This 84.38% decline in user activity has served as a leading indicator for the native XDC token, which has suffered a 62.5% decline on an annualized basis.
The pattern is not unique to legacy projects; it is also appearing in newer, high-profile infrastructure layers. Celestia, which garnered immense attention for its modular data availability architecture, has seen its network activity evaporate. Following a peak in 2024, when the network boasted 36,000 active addresses, current metrics reveal a 96.92% collapse, with active users falling to roughly 1,200. The correlation between this exodus and the price of the TIA token is undeniable, as the asset has retreated 98.2% from its all-time high, trading at approximately $0.35.
Chronology of a Network Contraction
To understand the current state of these "ghost chains," one must examine the timeline of their adoption curves. The period between 2021 and 2023 represented a gold rush for Layer-1 and Layer-2 development, characterized by massive venture capital inflows and high retail participation.
During 2021, the XDC Network benefited from the broader bull market sentiment, attracting developers and users seeking lower-cost alternatives to the Ethereum mainnet. By 2023, however, the landscape shifted. The introduction of high-throughput L2 solutions and competing modular architectures began to siphon liquidity and user interest away from older or less dynamic ecosystems.
Celestia’s trajectory followed a similar, albeit compressed, timeline. Launching with high expectations for scalability, it experienced a surge in early 2024. Yet, as the novelty of its modular design faded and the focus of the broader market shifted toward the next generation of interoperability protocols, its user base began to migrate. The drop in active addresses from 39,000 in 2023 to near-negligible levels today suggests that the network struggled to retain its developer ecosystem, which is the lifeblood of any L1 or L2 blockchain.
Sustainability Risks: The Tezos Case Study
The issue of sustainability extends beyond simple user counts into the realm of network economics. Tezos, a pioneer in self-amending blockchain technology, provides a case study in the decline of network revenue. Despite maintaining a market capitalization exceeding $400 million, the network has faced systemic challenges regarding transaction fees and, by extension, network demand.

Data from Artemis indicates that Tezos has experienced a 68% decline in fees and revenue over the past twelve months. In the context of Proof-of-Stake (PoS) networks, fees are a primary indicator of demand for block space. When fees decline, it implies that the network is either underutilized or that the cost of executing transactions has become decoupled from the value generated by those transactions. As the network’s utility has waned, the XTZ token has suffered, falling 95% from its historical peak. The decline in fee generation effectively signals that the network’s economic flywheel is no longer spinning, leaving the token price vulnerable to sell-side pressure from long-term holders.
Implications for Tokenomics and Investor Sentiment
The direct correlation between declining network activity and token price depreciation suggests that the market is becoming increasingly efficient at "pricing out" projects that fail to demonstrate utility. Investors are no longer content with whitepaper promises; they are looking at on-chain metrics, such as Daily Active Addresses (DAA), Total Value Locked (TVL), and fee-generation history.
The "ghost chain" phenomenon has several critical implications for the broader crypto industry:

- The "Utility Threshold": Networks that fall below a certain threshold of active participants often enter a negative feedback loop. As users leave, developers move to more active chains to seek greater impact for their applications. As developers leave, the ecosystem becomes stagnant, which further discourages new users.
- Valuation Re-calibration: The massive drawdowns seen in TIA, XTZ, and XDC suggest that the market is correcting the valuations of networks that were previously priced on potential rather than performance. This represents a healthy, albeit painful, maturation of the market.
- Institutional Skepticism: Institutional capital is increasingly focused on chains that provide verifiable, repeatable, and growing utility. Networks that cannot prove sustained demand will likely find it difficult to attract the institutional partnerships necessary for long-term viability.
Analytical Outlook: Can These Networks Pivot?
The challenge for these networks is not merely technological but strategic. For a network like Tezos, revitalizing demand requires an influx of new dApps (decentralized applications) or a breakthrough in enterprise adoption. For newer chains like Celestia, the path forward may involve finding a specific niche within the modular stack that cannot be easily replicated by competitors.
However, history suggests that once a network loses its "mindshare" and active user base, a turnaround is statistically rare. In the current landscape, the most successful chains are those that have fostered deep, entrenched developer communities and continuous innovation.
Conclusion: A Market in Transition
The current state of the blockchain market reflects a transition from a phase of "irrational exuberance" to one of "value-based assessment." The decline of networks like XDC, Celestia, and Tezos serves as a cautionary tale for both developers and investors. High market capitalization is not a static state; it is a lagging indicator of past success, not a guarantee of future stability.

As the industry moves forward, the divide between "ghost chains" and thriving ecosystems will likely widen. Projects that prioritize on-chain activity, sustainable revenue models, and genuine user utility will be the ones that define the next decade of blockchain development. Conversely, those that rely on speculative momentum without a foundation of active, daily usage will continue to face the reality of market-driven corrections. For stakeholders in these networks, the coming quarters will be critical, as they must demonstrate not just survival, but a return to the growth metrics that initially justified their valuations. The era of the "ghost chain" appears to be reaching an inflection point, where only those networks providing tangible value to their users will maintain their standing in the global digital asset landscape.