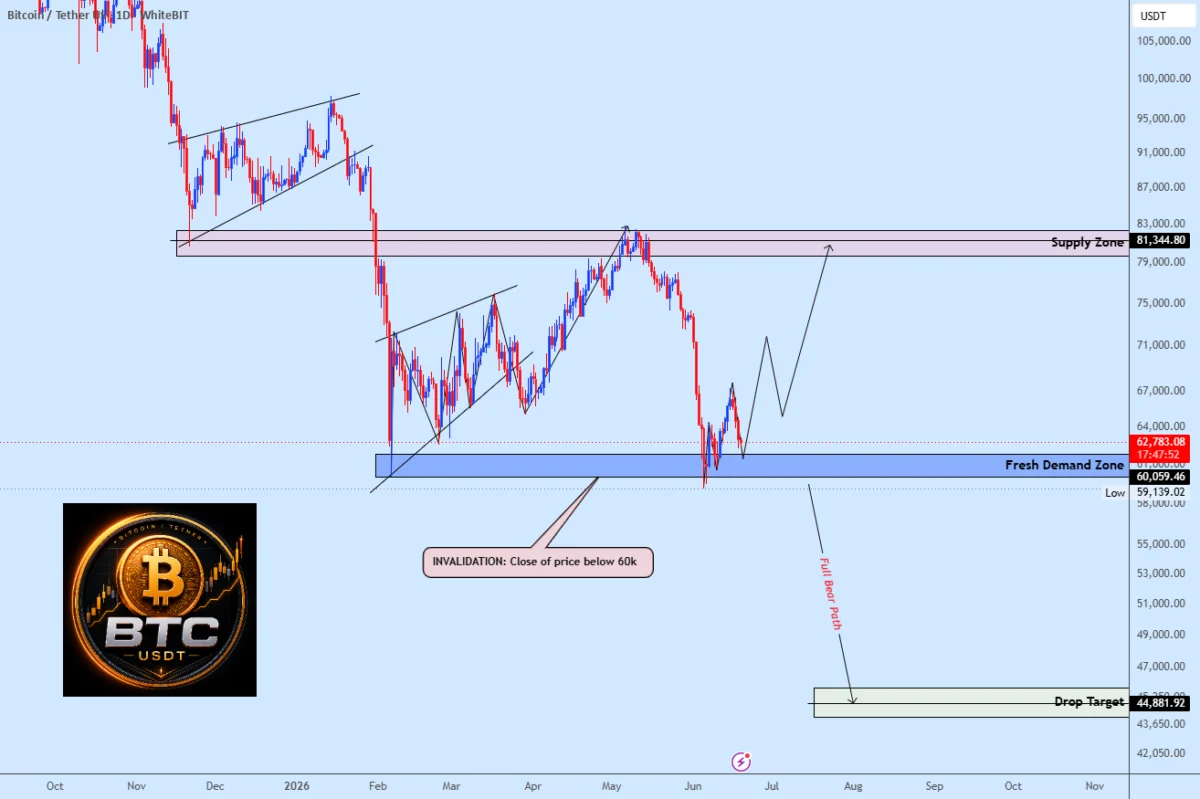
Bitcoin currently finds itself at a pivotal technical juncture, with market participants closely monitoring the $60,000 threshold as a definitive indicator of short-term trend direction. Following a period of sustained downward pressure, the primary cryptocurrency has entered a vital demand zone that industry analysts identify as the last line of defense for the prevailing bullish structure. This situation has been highlighted by market analysts, including the recent assessment from TradingView contributor weslad, who posits that the $60,000 mark is not merely a psychological round number but a functional pivot point that will determine whether Bitcoin enters a recovery phase or experiences a more profound structural breakdown.
The Significance of the $60,000 Pivot Point
The $60,000 price level has emerged as a focal point for institutional and retail traders alike. Historically, round-number psychological support levels often serve as magnets for liquidity, where institutional algorithms and retail stop-loss orders congregate. When an asset approaches such a level, the market typically enters a high-volatility phase characterized by aggressive buying or, conversely, a cascade of liquidations if the support fails to hold.
According to technical analysts, the current demand zone sitting at the $60,000 threshold represents a historical area of interest where buyers previously demonstrated significant conviction. If this demand remains robust, it suggests that the recent corrective phase—which saw Bitcoin retreat from its yearly highs—has reached a point of exhaustion. A successful defense of this level would provide the necessary base for a reversal, potentially setting the stage for a recovery toward the $81,000 supply zone. This upside target represents the approximate origin of the recent downward trend, a level that would logically see significant resistance from sellers looking to mitigate losses or exit positions.
Chronology of Recent Market Movements
To understand the current tension, one must examine the timeline of Bitcoin’s performance over the past several months. Following the highly anticipated halving event earlier this year, the market witnessed a surge in optimism. However, the anticipated "post-halving supply shock" did not materialize with the immediate velocity many expected. Instead, Bitcoin entered a period of consolidation characterized by lower highs and lower lows.
Throughout May and early June, macroeconomic headwinds—including shifting expectations regarding Federal Reserve interest rate policy and geopolitical instability—contributed to a steady erosion of bullish momentum. By mid-June, Bitcoin began to lose ground, sliding from the $70,000 range toward the current testing ground. This decline was marked by reduced trading volume in spot markets, suggesting a lack of conviction among buyers at higher price levels. As the price approached the $60,000 mark, order books showed a concentration of bids, confirming that market participants are viewing this specific zone as a high-stakes battleground for control of the trend.

Data-Driven Market Perspectives
Quantitative analysis of the current market state reveals that the $60,000 level is heavily influenced by the behavior of long-term holders versus short-term speculators. On-chain data indicates that while many institutional entities have maintained their holdings, a significant number of speculative addresses, which entered the market during the recent bull run, are now underwater.
The implication of a failure to hold $60,000 is twofold. First, from a technical perspective, a decisive close below this level would invalidate the bullish "higher-low" structure that has been in place since the market’s recovery from the previous cycle’s lows. Second, it would likely trigger a wave of forced liquidations among leveraged traders. In modern crypto markets, liquidity often follows a "cascading" pattern; when a major support level is breached, the resulting wave of stop-loss orders can force the price significantly lower in a very short time frame. Analysts note that should $60,000 fall, the next major support levels do not appear until the $52,000 to $55,000 range, which would represent a substantial correction from current values.
The Mechanics of Liquidity and Market Sentiment
Market liquidity is a primary driver in the current environment. The term "liquidity grab," often used by analysts in this context, refers to a market maneuver where the price is driven below a support level to trigger stop-loss orders. These stop-loss orders effectively act as market sell orders, providing the liquidity needed for larger institutional players to enter or accumulate positions at a lower cost.
If Bitcoin can defend the $60,000 zone, it signals that the market has successfully absorbed the selling pressure. A bounce from this level would likely be viewed by institutional observers as a "retest" of support, a standard technical formation that often precedes a move toward higher resistance levels. Conversely, if the price lingers at $60,000 without showing signs of a bounce, the risk of a "breakdown" increases. In such scenarios, the lack of buying interest often leads to a slow, grinding decline rather than an immediate crash, which can be equally damaging to investor sentiment.
Broader Macroeconomic Implications
Bitcoin’s current struggle does not exist in a vacuum. It is deeply intertwined with the broader global financial landscape. Investors are currently weighing the impact of sticky inflation data and the persistence of high-interest rates in the United States. High-interest rates typically increase the cost of capital, making risk assets like Bitcoin less attractive compared to "risk-free" assets like Treasury bonds.
Furthermore, the integration of Bitcoin into the traditional financial system through Spot ETFs has introduced new dynamics. ETF flows, which were a massive driver of the rally to new all-time highs, have seen periods of net outflows during recent price drops. If institutional ETF buyers view the $60,000 level as a long-term value opportunity, we may see a resurgence in inflows that could act as a buffer against further downside. However, if institutional appetite wanes, the burden of supporting the price falls onto retail investors and whales, who may be more prone to panic selling during volatility.

Future Scenarios: Recovery vs. Correction
The path forward for Bitcoin is binary, dependent entirely on the market’s reaction to the current support zone. In the recovery scenario, the $60,000 level holds, and Bitcoin begins a systematic process of reclaiming resistance levels at $65,000 and $72,000. This path would require a catalyst—perhaps a shift in regulatory tone, positive macroeconomic data, or an increase in institutional buying activity. Successfully reclaiming these levels would put the $81,000 target within reach, effectively restoring the bullish narrative.
In the correction scenario, a failure to hold $60,000 would likely lead to a period of market capitulation. During such phases, the media cycle often shifts to a bearish tone, further discouraging new capital entry. While a deep correction is often painful for short-term holders, long-term proponents of the asset frequently argue that such periods are necessary to "flush out" leverage and establish a sustainable, organic base for future growth.
Expert Consensus and Market Readiness
Industry experts remain divided on the outcome, though there is a consensus that the next 72 to 96 hours of trading will be critical. The primary takeaway from the current analysis is that caution is warranted. Traders are advised to look for confirmation—specifically, a high-volume bounce or a sustained closure above the $60,000 level—before assuming the threat of a breakdown has passed.
For retail investors, the current volatility underscores the importance of risk management. The $60,000 level is widely recognized as a "line in the sand," meaning that those who do not have a high tolerance for drawdown may choose to tighten their stop-loss strategies. Meanwhile, for those with a longer time horizon, the current testing of support is often viewed as a standard, albeit stressful, part of the market cycle.
Ultimately, Bitcoin’s ability to navigate this specific test will serve as a bellwether for the broader digital asset space. If the premier cryptocurrency can weather this storm, it will reaffirm its strength as a resilient asset class. If it falters, the market will need to prepare for a period of recalibration, as traders and institutions alike look to find a new equilibrium in an increasingly complex and interconnected global economy. The data suggests that while the setup is fragile, the fundamentals of the Bitcoin network remain unchanged, leaving the market to decide whether the current price is a bargain or a warning sign.