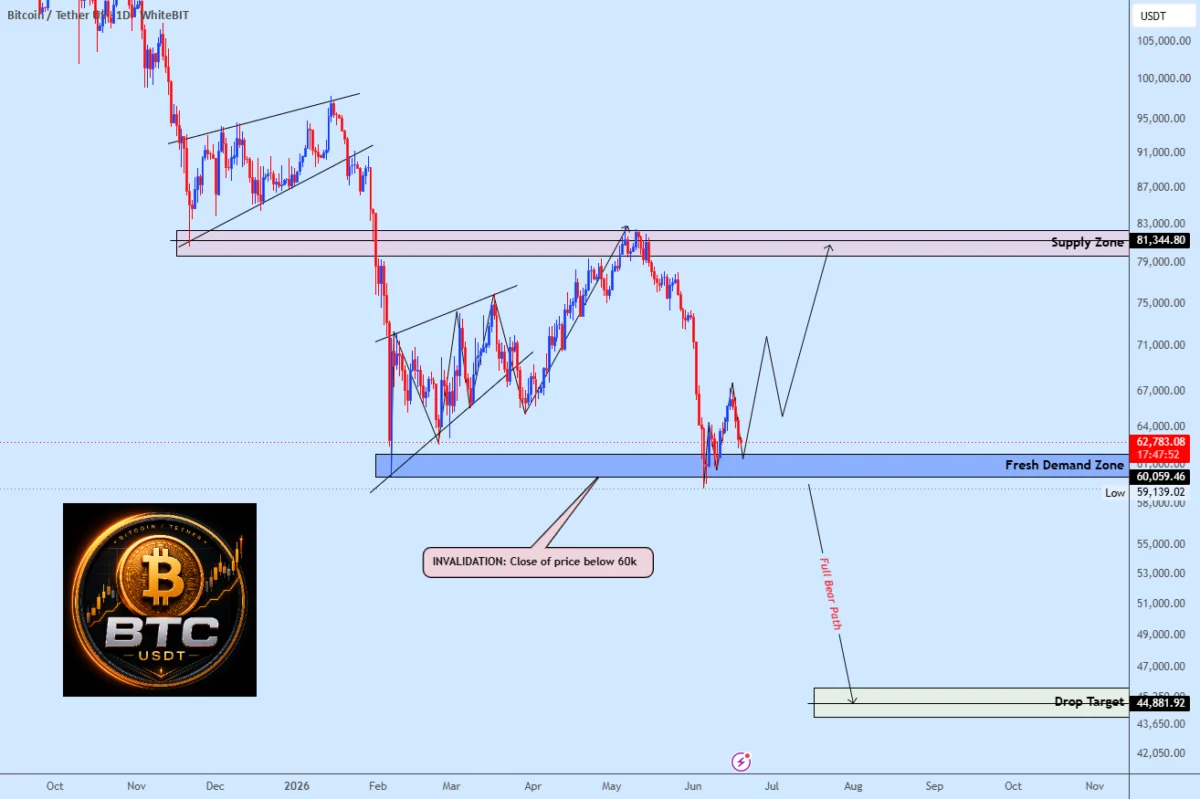
Bitcoin has returned to a critical juncture, with the $60,000 price point emerging as the focal point for market participants, analysts, and institutional investors alike. This specific level, which carries significant weight both as a psychological threshold and a technical support zone, is currently being scrutinized to determine the asset’s near-term trajectory. According to a recent analysis by market observer weslad, the BTC/USDT pair has entered a fresh demand zone that serves as the final line of defense for the prevailing bullish narrative. As the cryptocurrency market navigates a period of heightened volatility, the ability of Bitcoin to maintain this position will likely dictate whether the digital asset initiates a recovery toward the $81,000 supply area or enters a more profound phase of price discovery to the downside.
The Significance of the $60,000 Threshold
The $60,000 mark is far more than a mere round number in the context of technical analysis. It represents a "demand zone"—a price bracket where historical buy orders have clustered, suggesting that a significant volume of capital is ready to enter the market when prices dip to this range. In market microstructure, these zones are areas where institutional buyers typically look to accumulate positions, believing that the downside risk is mitigated by the strength of previous historical support.
However, the analysis from TradingView highlights that this zone is currently fragile. The market is witnessing a classic test of sentiment; if the bulls can successfully defend this perimeter, it reinforces the narrative that the recent bearish pressure has reached a state of exhaustion. Conversely, a failure to hold this support would likely trigger a cascade of stop-loss orders. When large numbers of traders place their stop-loss triggers just below a major support level, the breach of that level can lead to "forced liquidations," where the automated selling of positions creates a feedback loop that accelerates the decline.
Chronology of the Recent Market Contraction
To understand why the $60,000 level is so vital, one must look at the recent timeline of Bitcoin’s price action. Throughout the current quarter, Bitcoin has experienced a series of corrections following its attempt to solidify gains near the $70,000 range. The decline began as macroeconomic pressures, including shifting interest rate expectations from the Federal Reserve and fluctuating inflows into spot Bitcoin Exchange Traded Funds (ETFs), cooled the market’s enthusiasm.
In the weeks leading up to this current test, Bitcoin saw a steady erosion of momentum. The retreat from the upper $70,000s toward the current $60,000 support level was not a singular event but a gradual process of liquidity depletion. By mid-June, the market began to show signs of over-extension, leading to a consolidation phase. This consolidation is standard in high-growth asset classes, yet the speed of the recent downward trend has forced traders to reassess their positions. The current demand zone is effectively the last line of support before the market enters a void where fewer historical buy orders exist to catch a falling price.

Supporting Data and Market Dynamics
The current market environment is characterized by a mix of cautious optimism and defensive positioning. On-chain data metrics, such as the exchange reserve ratios and the "Spent Output Profit Ratio" (SOPR), suggest that long-term holders are currently reluctant to sell at these levels. This lack of selling pressure is the primary reason the $60,000 floor has held thus far.
Furthermore, institutional participation remains a critical variable. Throughout the past year, the influx of capital through US-based spot Bitcoin ETFs has provided a structural floor for the price. When Bitcoin dips toward $60,000, data often shows a concurrent spike in ETF purchasing activity, indicating that institutional demand is still robust even when retail sentiment turns sour. However, these institutional players are also sensitive to macroeconomic data. If the US Consumer Price Index (CPI) reports or jobs data indicate that the economy is cooling or that inflation remains sticky, the motivation for these institutions to add to their holdings at $60,000 may diminish, potentially leaving the support level vulnerable to a breakdown.
Implications of a Potential Recovery
Should the bulls succeed in defending the $60,000 level, the technical outlook shifts toward a recovery. The target identified by market analysts is the $81,000 supply area. This level is significant because it represents the origin of the most recent downward momentum. In technical analysis, the "supply area" is where sell orders are stacked, meaning a move back to this price would likely see significant selling pressure as traders look to exit positions they opened during the previous rally.
Achieving this recovery would require more than just holding the support line; it would necessitate a fundamental shift in market volume. A "V-shaped" recovery—where the price bounces immediately off support—is possible, but a more sustainable outcome would be a period of consolidation above $60,000, allowing the market to build a new base before attempting to reclaim higher levels. This base-building phase is essential to prove that the demand is genuine and not merely a speculative bounce driven by short-covering.
The Risks of a Decisive Breakdown
The alternative scenario—a decisive close below $60,000—carries heavy risks for the bullish thesis. If Bitcoin breaks this level, it signals that the market has transitioned from a consolidation phase to a structural correction. In this scenario, the next major support levels would likely fall toward the $52,000 to $55,000 range, which acted as a major area of congestion during previous market cycles.
A breakdown of $60,000 would also change the psychological profile of the market. It would likely lead to a period of "capitulation," where weaker hands are forced out of their positions, potentially clearing the way for a deeper, albeit more durable, bottom to form. While this is painful for short-term traders, long-term market participants often view these periods of capitulation as the healthiest way to reset the market, removing excessive leverage and preparing the asset for its next sustainable leg upward.

Broader Economic Context
The current situation with Bitcoin does not exist in a vacuum. It is heavily influenced by the global macroeconomic climate, specifically the liquidity conditions in the US banking system. Bitcoin has increasingly acted as a "risk-on" asset that tracks closely with the Nasdaq 100 and other tech-heavy indices. When investors move out of risk assets due to fears of economic stagnation, Bitcoin is often among the first to see liquidity pulled from its markets.
The Federal Reserve’s "higher-for-longer" interest rate stance has historically served as a headwind for non-yielding assets like Bitcoin. However, the anticipated pivot toward lower rates—or at least the cessation of rate hikes—provides a potential tailwind. If the market perceives that the worst of the economic tightening is over, the pressure on the $60,000 support level may ease as capital flows back into speculative assets.
Expert Perspectives on Market Volatility
Market experts maintain that while technical levels like $60,000 are essential for algorithmic trading and short-term positioning, they should not be viewed as absolute guarantees. Market volatility is often driven by "black swan" events or sudden shifts in regulatory policy. For example, any news regarding the integration of Bitcoin into the traditional financial plumbing of the global banking system or changes in the tax treatment of digital assets can quickly override technical setups.
Analysts emphasize that the most successful market participants are those who remain agnostic about the outcome. By focusing on risk management—ensuring that positions are sized correctly and that stops are set at logical points—investors can navigate the current $60,000 test without being caught off guard by a sudden move in either direction. The current consensus among seasoned traders is one of "watch and wait." They are waiting for the market to declare its intent through volume and price action rather than attempting to guess the outcome before the support has been truly tested.
Conclusion: A Binary Outcome for the Near Term
The current situation for Bitcoin is, in many respects, a binary event. The price is currently oscillating in a narrow range, indicating that the market is waiting for a catalyst to push it in one direction or the other. The $60,000 support level acts as the divider between two vastly different market regimes: one of recovery and potential new highs, and one of deeper correction and extended consolidation.
For the remainder of the quarter, the primary objective for market observers will be to monitor the daily close. A series of closes above $60,000 will build the confidence required for a move toward $81,000. Conversely, a failure to maintain this level will force a re-evaluation of the entire bullish cycle. Regardless of the outcome, the current tension surrounding this price level serves as a reminder of the inherent volatility and the complex interplay of technical, institutional, and macroeconomic forces that define the Bitcoin market today. As the market moves forward, the ability of participants to remain disciplined in the face of this uncertainty will be the defining factor in their performance.