The wider cryptocurrency market has experienced a notable shift in momentum as capital flows visibly rotate from major digital assets toward alternative cryptocurrencies. Among the primary beneficiaries of this changing market dynamic is The Graph (GRT), which recently recorded an impressive 37.7% rally over a seven-day period. This bullish price action occurred despite a minor marketwide cooling period triggered by Bitcoin (BTC), which faced a healthy technical correction pulling its valuation down from a local peak of $87,400 to the $83,000 threshold.
While short-term price volatility remains an inherent characteristic of the digital asset landscape, underlying macroeconomic indicators and shifting dominance metrics suggest a deeper structural change in how market participants are allocating capital. Industry analysts and market observers are closely monitoring these movements to determine whether this altcoin resurgence represents the early stages of a sustained medium-term recovery or merely a temporary relief rally within a broader consolidation cycle.
Decoding Market Dominance: The Shift Toward Risk-On Sentiment
To understand the catalysts behind The Graph’s recent valuation surge, market participants must examine broader liquidity indicators, specifically Tether (USDT) dominance and Bitcoin dominance metrics. Throughout late summer, liquidity patterns have displayed a gradual transformation. Tether dominance—a metric that measures the percentage of the total cryptocurrency market capitalization held in the leading stablecoin—has steadily declined from approximately 8.5% in mid-August to a lower baseline of roughly 6.52%.
A declining stablecoin dominance ratio typically indicates that investors are deploying sidelined capital back into risk assets rather than seeking refuge in cash equivalents. Simultaneously, Bitcoin dominance experienced a downward trend throughout September. Historically, when Bitcoin dominance recedes alongside a decrease in stablecoin reserves, capital flows downstream into altcoins. This rotation signals a distinct "risk-on" short-term outlook among retail and institutional crypto market participants alike, creating a favorable macro environment for decentralized infrastructure tokens like GRT. At the time of reporting, the broader Altcoin Index hovered at a neutral-to-optimistic reading of 51, further reflecting a balanced yet receptive market appetite for non-Bitcoin assets.
A Five-Week Rebound: Tracing The Graph’s Recovery Timeline
The recent weekly performance of The Graph is best understood within the context of a broader multi-week recovery timeline that began taking shape in the depths of the late-summer market correction.

In August, digital asset markets endured widespread downward pressure, pushing GRT down to a significant swing low of $0.013. This depressed valuation marked a critical technical testing ground for the decentralized indexing and querying protocol. However, the market sentiment quickly pivoted as buyers stepped in to accumulate tokens at historically discounted levels.
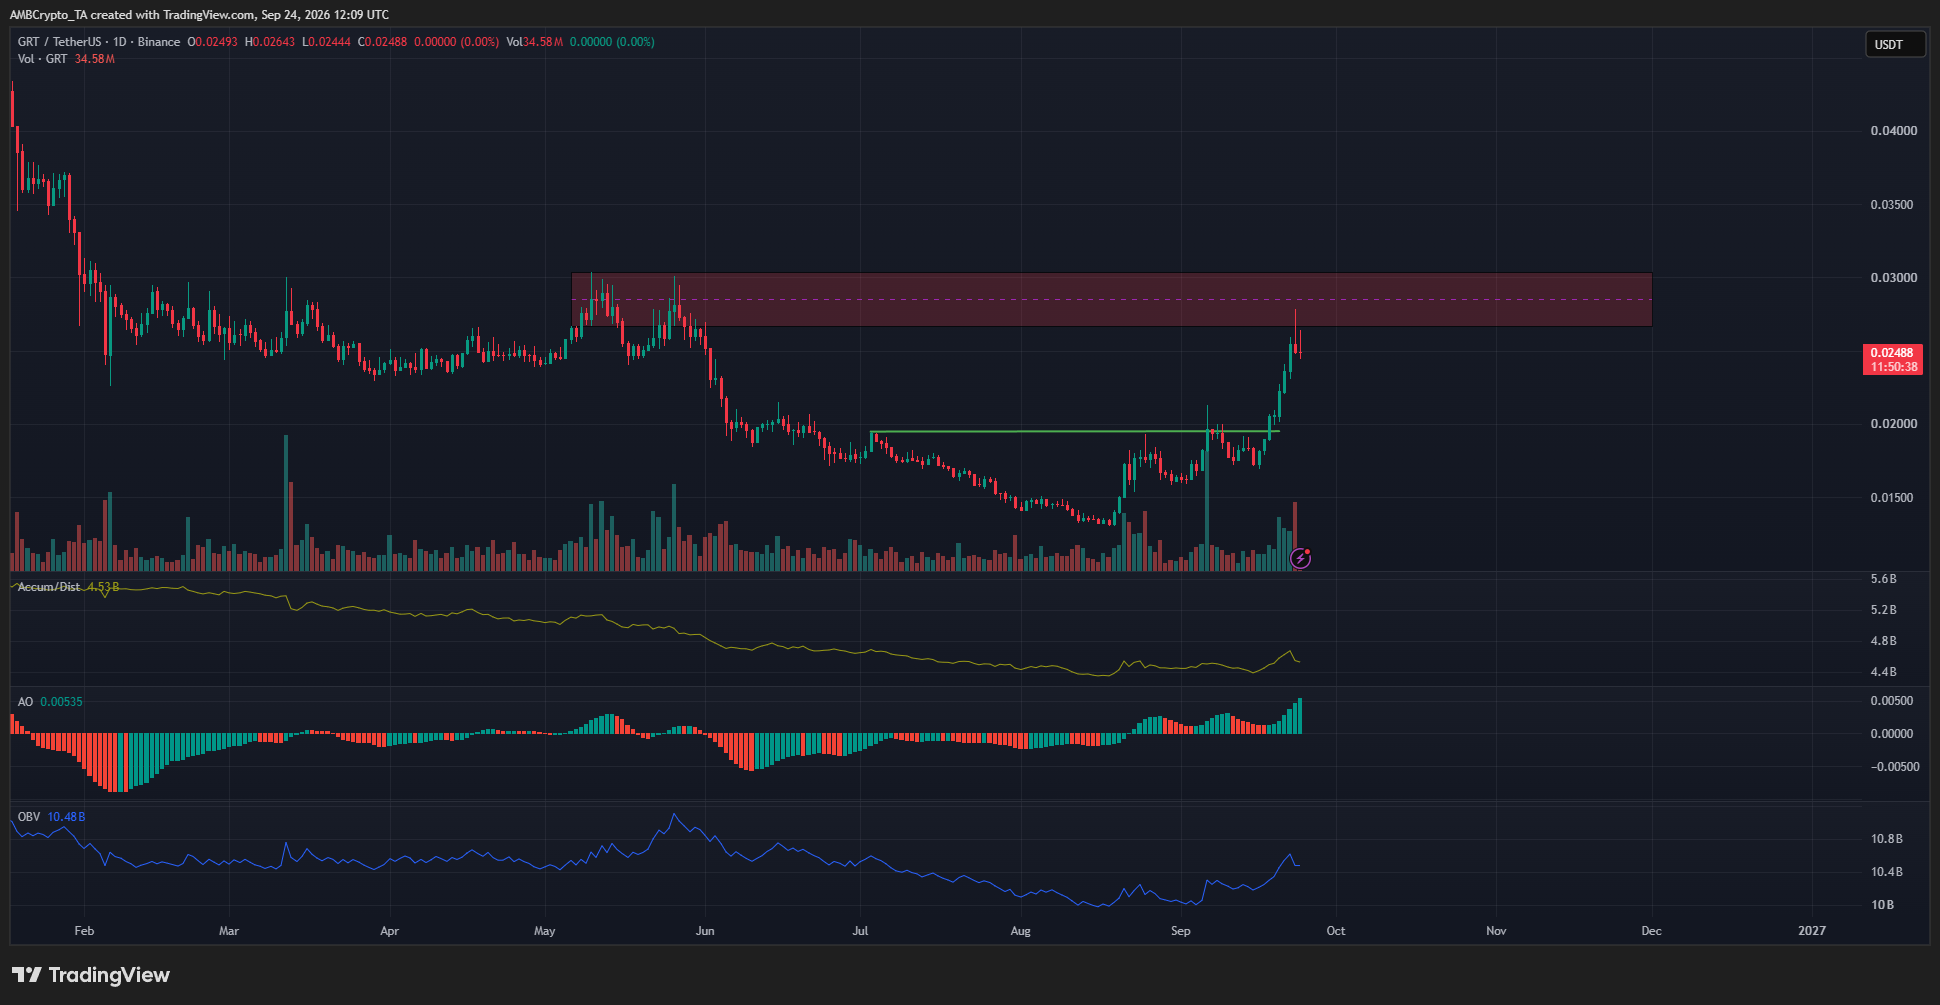
Over the subsequent five weeks, GRT embarked on a steady upward trajectory, culminating in a remarkable 90% cumulative recovery from its August lows. This aggressive buying pressure gradually eroded lower highs on the higher timeframe charts, culminating in a definitive technical breakout on September 6th, when GRT breached its previous lower high resistance barrier at $0.01947. This structural shift signaled to momentum traders and technical analysts alike that the multi-month downtrend may have exhausted its momentum, paving the way for sustained bullish expansion.
Technical Analysis: Navigating Key Supply Zones and Resistance Levels
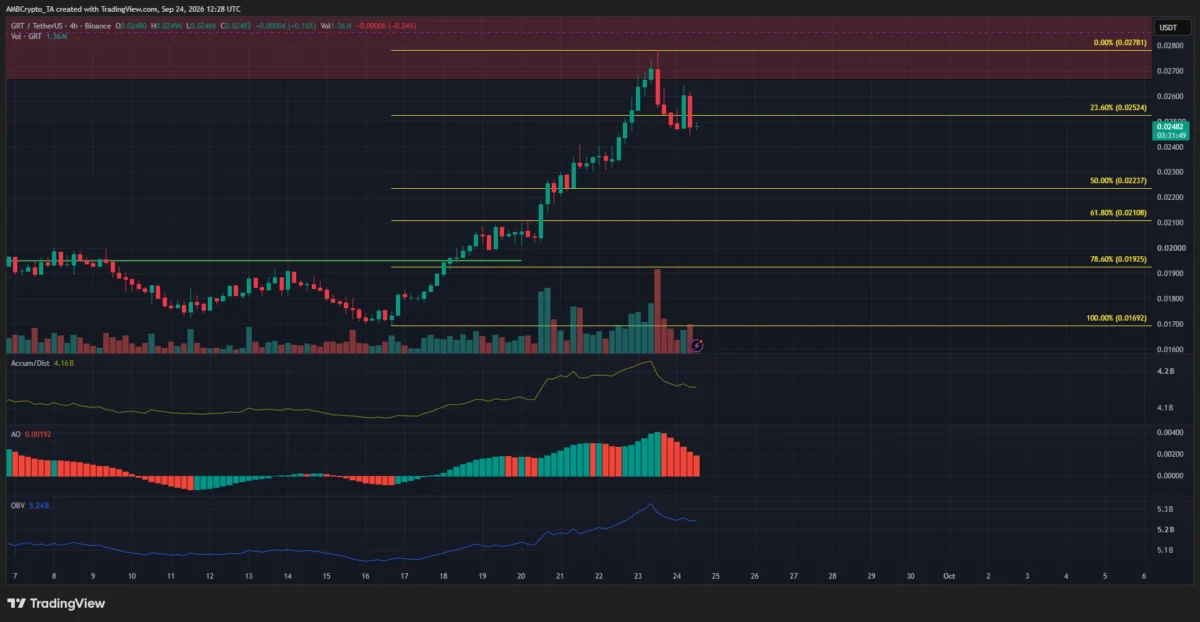
Despite the impressive recovery, technical analysts caution that GRT faces significant structural hurdles before a definitive, long-term bullish trend reversal can be confirmed. A primary area of interest lies within the $0.023 to $0.030 price zone, which served as a heavy consolidation and accumulation range during earlier market cycles.
Investors who acquired GRT tokens during that earlier consolidation phase are only recently seeing their portfolios return to breakeven or minor profit levels. Consequently, this historical price corridor functions as a robust supply zone, where many long-term holders may choose to liquidate positions to recover initial capital or lock in gains.
Furthermore, a prominent bearish order block has been identified between the $0.026 and $0.030 price levels. Market strategists note that a confirmed daily session close above the $0.030 threshold would serve as a highly reliable signal of dominant buyer control, effectively invalidating lingering macroeconomic overhead resistance.
Complementing these price action observations, on-chain and auxiliary technical indicators present a largely constructive outlook. The Accumulation/Distribution (A/D) line has maintained an upward slope in tandem with the On-Balance Volume (OBV) metric, indicating that steady, organic buying volume continues to support the asset. Additionally, the Awesome Oscillator has flashed positive momentum readings, reinforced by sustained trading volumes that remain above historical daily averages.
Evaluating Trading Strategies: Should Market Participants Buy the Dip?
Following the broader crypto market correction that saw Bitcoin retrace from $87.4k to $83k, GRT experienced a predictable intraday retracement, shedding roughly 8.5% over a 24-hour window. This pullback has naturally ignited discussions among short-term swing traders regarding optimal entry points and accumulation strategies.
Analysis of the 4-hour technical chart reveals that while the immediate timeframe trend remains constructive, disciplined risk management is essential. Using Fibonacci retracement tools applied to the recent impulsive swing move, technical analysts have highlighted the $0.01925 to $0.02108 price corridor as the optimal "golden pocket" retracement zone.
A measured pullback into this specific liquidity pocket, followed by a confirmed bullish price reaction, would present a high-probability entry setup for swing traders looking to align with the prevailing medium-term momentum. However, analysts emphasize that any localized dip-buying strategy remains intrinsically tied to Bitcoin’s price stability. Specifically, Bitcoin must hold its newly established support range between $80,000 and $82,000—which previously acted as a formidable supply barrier. A deeper, more aggressive sell-off in the premier cryptocurrency could easily dampen broader risk sentiment, invalidating short-term altcoin setups and delaying the projected recovery timeline for infrastructure protocols.
Broader Implications for Decentralized Infrastructure and Web3 Markets
The recent price volatility and capital rotation into The Graph highlight the evolving correlation between macroeconomic crypto sentiment and specialized decentralized utility tokens. As a foundational pillar of Web3 architecture—providing critical indexing and data querying services for decentralized applications (dApps) across multiple blockchains—GRT’s market performance often mirrors broader developer activity and infrastructure demand.
The recent influx of capital into altcoins, underscored by shrinking stablecoin reserves and declining Bitcoin dominance, suggests that investors are increasingly looking beyond primary store-of-value assets to capture higher-beta growth within specialized crypto sectors. If macroeconomic liquidity conditions remain favorable and Bitcoin successfully defends its key support thresholds, decentralized data networks like The Graph are well-positioned to maintain their upward trajectory. Conversely, any unexpected regulatory headwinds or broader macroeconomic tightening could quickly revert market sentiment back into a defensive posture. For now, market participants, traders, and long-term stakeholders continue to monitor critical resistance levels and volume indicators as GRT navigates this pivotal juncture in its market cycle.