
Ethereum (ETH), the world’s second-largest cryptocurrency by market capitalization, has recently experienced a modest price recovery following a brutal wave of liquidations that dominated the final week of October. While spot prices have managed to claw back some ground from local lows, on-chain metrics, technical indicators, and derivative market structures suggest that this upward movement is merely a temporary pause in aggressive selling pressure rather than the dawn of a sustained bull run. Market analysts and traders are closely monitoring key technical thresholds as ETH hovers precariously between critical support and resistance zones, weighed down by weak trading volumes and persistent macroeconomic headwinds within the digital asset sector.
Chronology of the October Sell-Off and Recent Price Action
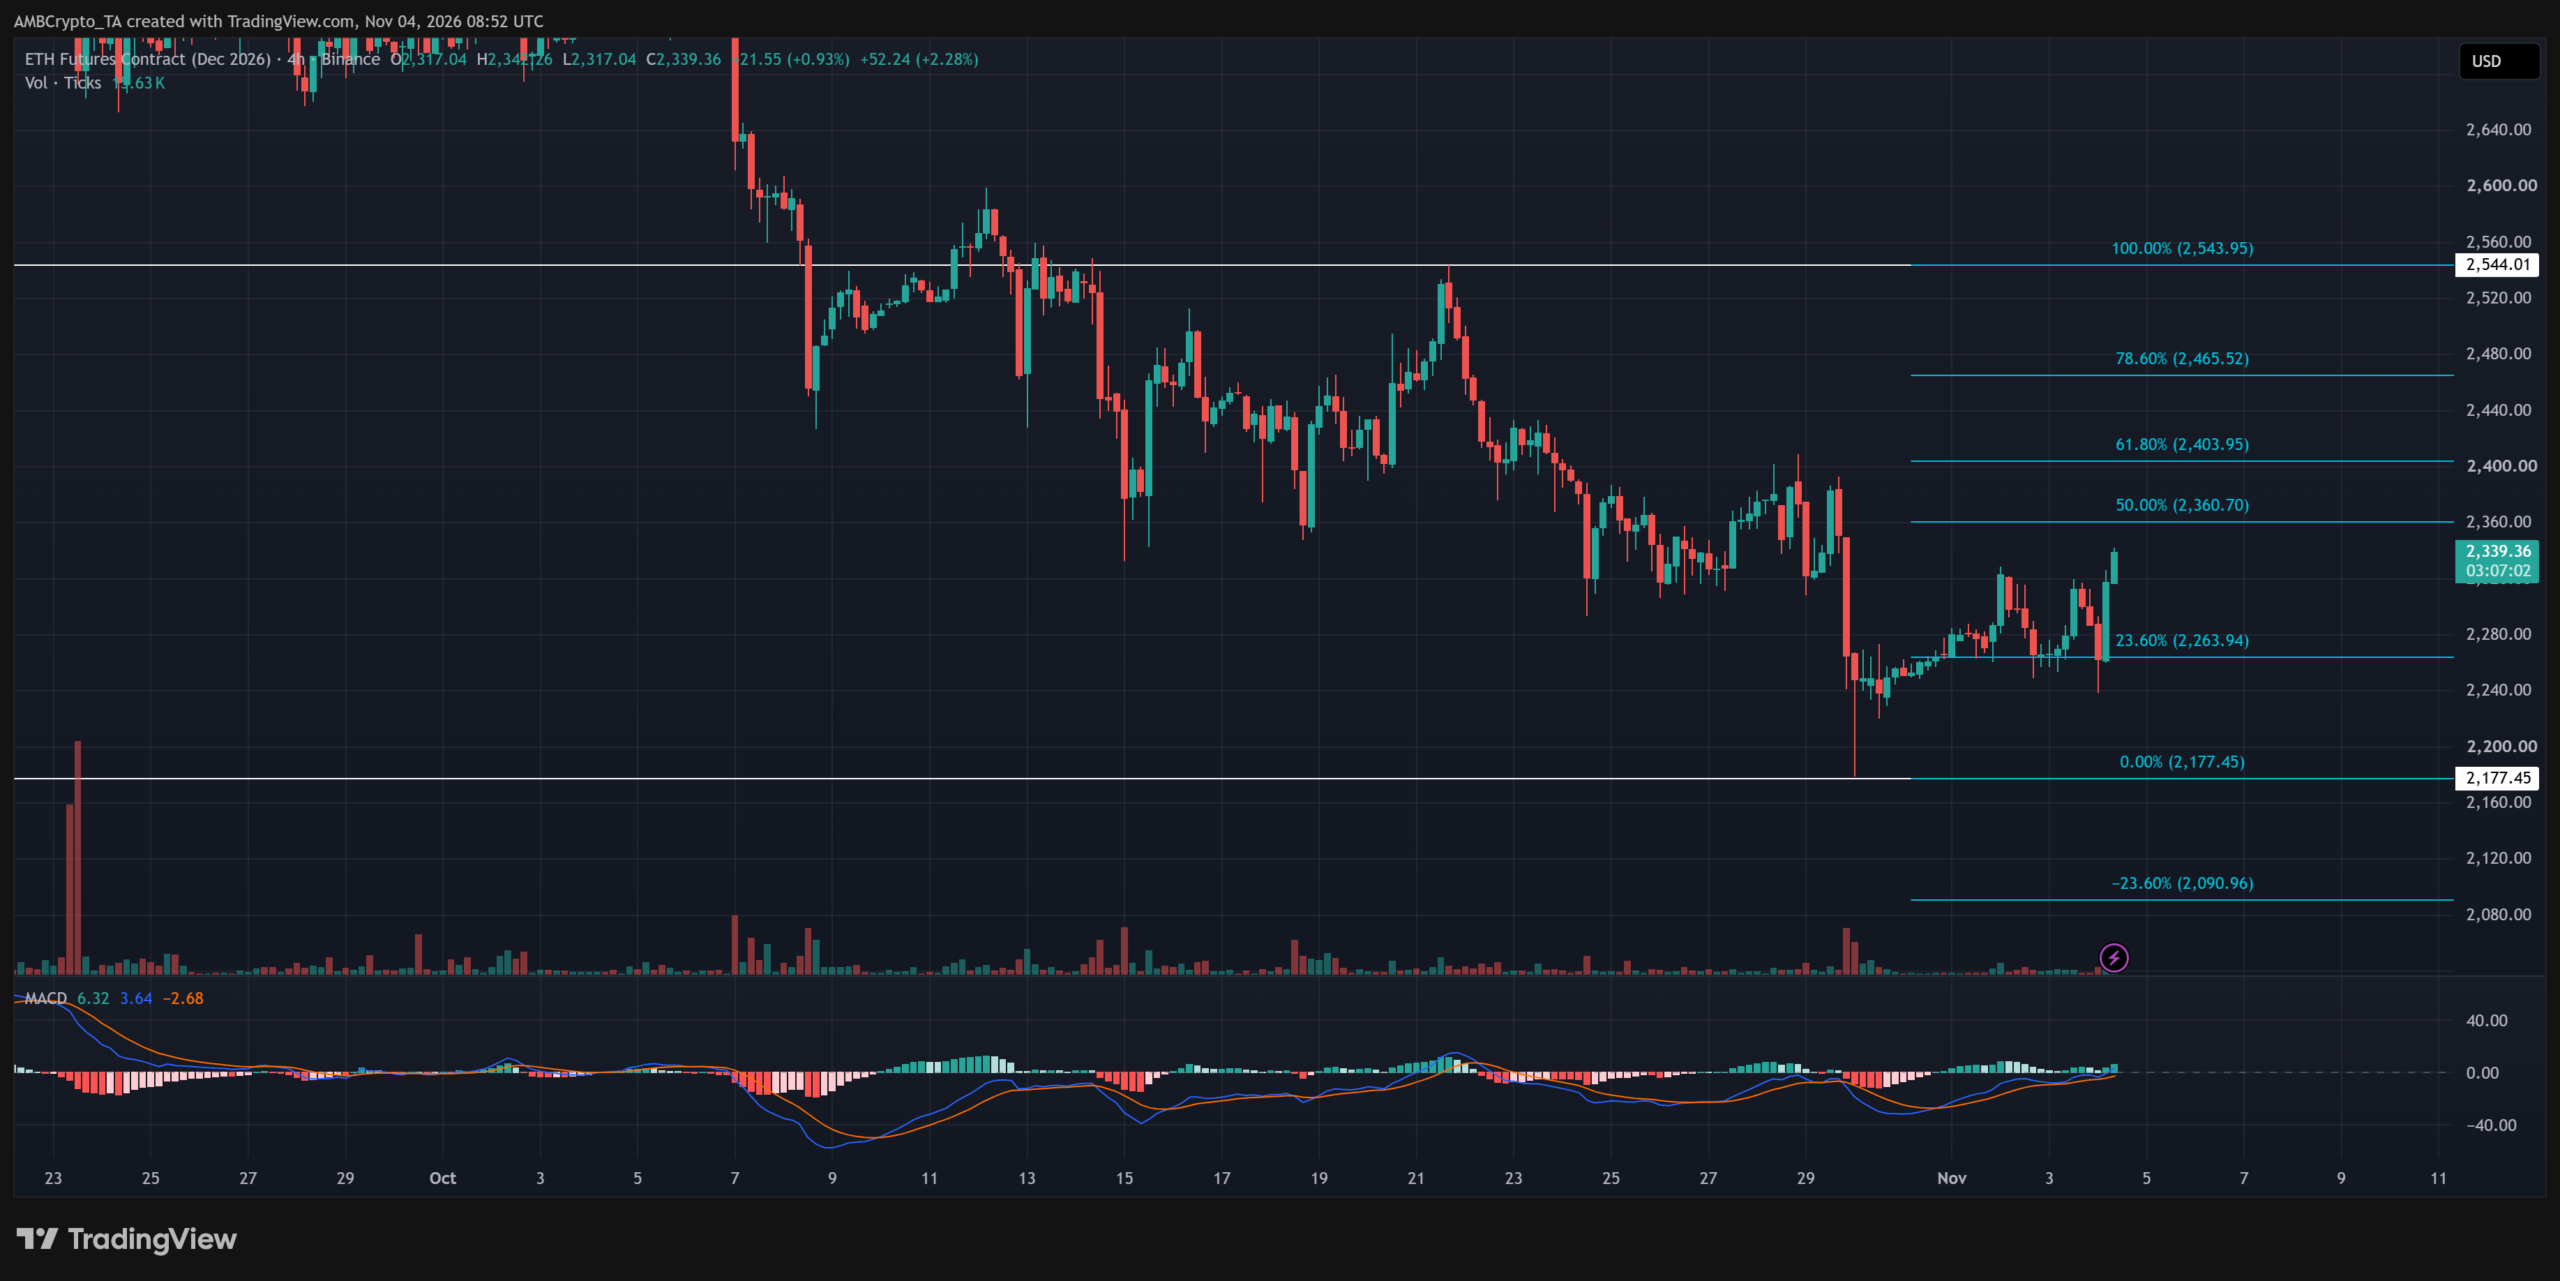
The roots of Ethereum’s current precarious position trace back to the final week of October, a period marked by extreme market volatility and systemic deleveraging across major derivatives exchanges. A cascade of long-position liquidations forced ETH down to a cyclical low of $2,177.45. This sharp correction shook market confidence and effectively wiped out months of structural gains, triggering a wave of capitulation among leveraged retail and institutional traders alike.
As the heavy selling pressure finally exhausted itself near the $2,177 floor, bargain hunters and short-term speculators stepped in, providing the necessary buying pressure to lift the asset. ETH subsequently experienced a 2.28% relief rally, climbing to an intraday high of $2,339.36. However, this recovery has failed to alter the broader macro-structure visible on lower-timeframe charts. On the four-hour timeframe, Ethereum continues to print a textbook pattern of lower highs and lower lows—a definitive hallmark of an active downtrend. Consequently, market observers note that sellers remain firmly in control of the medium-term direction, treating the recent bounce as a standard retracement within a larger bearish channel.

Technical Landscape: Critical Support and Resistance Levels
As Ethereum attempts to stabilize, traders are zeroing in on several vital price milestones that will dictate the token’s trajectory over the coming sessions. Immediate resistance is found at the 50% Fibonacci retracement level, situated at $2,360.70. A decisive, high-volume break above this threshold could open the door for a push toward $2,403.95, a historical inflection point where heavier selling interest is expected to rein in bullish ambitions.
Conversely, if the bulls fail to breach the $2,360.70 resistance, or if sellers successfully defend the broader downtrend, ETH faces renewed downside risk. A rejection at this level could quickly drive prices back down toward the immediate support zone at $2,263.94. Furthermore, underlying trading volumes during this recovery phase remain remarkably anemic. This lack of robust capital inflow indicates that institutional and high-net-worth investors have yet to make serious commitments to support the current price action, leaving the recovery vulnerable to sudden liquidity shocks.
Investor Sentiment and the Role of Market Psychology
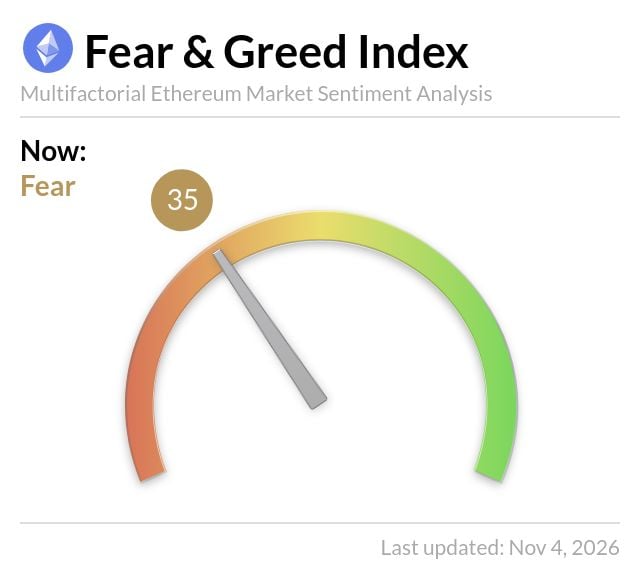
Market sentiment surrounding Ethereum remains heavily subdued, heavily mirroring broader macroeconomic anxieties and declining inflows into derivative investment products. As of November 4, the widely tracked Crypto Fear and Greed Index stands firmly at 35, placing market psychology squarely in "fear" territory. Historically, readings ranging between 25 and 49 reflect acute market uncertainty, a state where selling pressure may temporarily subside due to market exhaustion, but fails to trigger an immediate, organic surge in aggressive buying demand.
This prevailing aura of caution has rendered many retail and institutional investors unwilling to deploy fresh capital into ETH. While some contrarian analysts argue that persistent fear can ultimately lay the groundwork for long-term accumulation phases, the immediate consequence of weak sentiment is an elevated vulnerability to downward volatility. With trading volumes sluggish and investors remaining on the sidelines, future selling campaigns face significantly less resistance, increasing the statistical likelihood of another leg down unless a profound shift in market psychology occurs.
Derivative Markets and High-Risk Liquidation Clusters
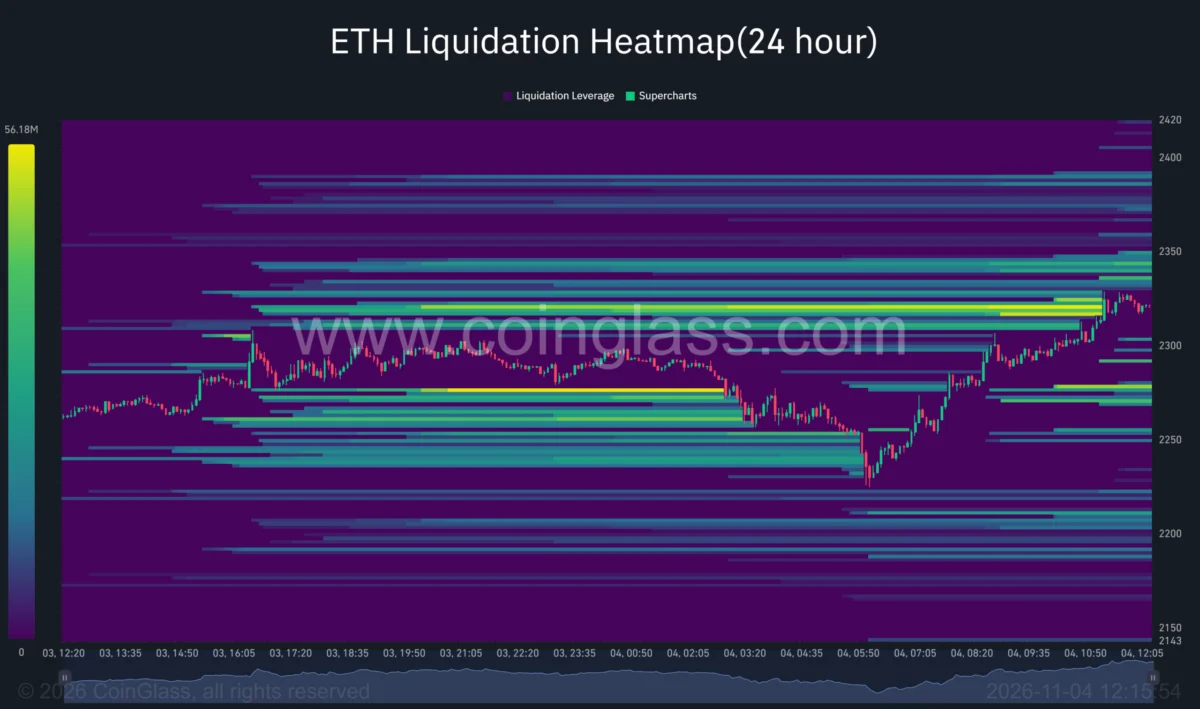
Beyond spot market dynamics, Ethereum’s immediate price discovery mechanism is heavily dictated by the distribution of leveraged positions across derivatives platforms. According to data from liquidation heatmaps, the single largest cluster of leveraged short positions is currently concentrated between the $2,330 and $2,350 price band.
Should an influx of spot buying push ETH decisively through this specific corridor, trapped short sellers would be forced to close their positions via automated buy orders, potentially triggering a short squeeze that could temporarily accelerate the rally. However, market makers warn that any liquidity pool encountered above $2,370 could stymie the momentum, causing the rally to stall and subsequently subjecting leveraged long traders—who accumulated positions below the $2,300 mark—to severe margin pressures.
On the flip side, the downside liquidation landscape poses an equally potent threat. Analysts note that if ETH slips below the immediate local support zone of $2,275 to $2,285, it could clear the path for accelerated algorithmic selling toward the $2,250 milestone. A failure to hold the $2,250 floor would likely puncture another dense liquidation pool situated between $2,209 and $2,210, deepening the downside pressure and potentially re-testing the cycle lows established in late October.
Broader Market Implications and Outlook
The current state of Ethereum serves as a microcosm for the broader digital asset market, highlighting the fragile equilibrium between exhausted sellers and hesitant buyers. While the cessation of October’s aggressive liquidation cascade has provided a temporary reprieve for ETH holders, the absence of strong fundamental demand and volume support suggests that the market is far from out of the woods.
For a true trend reversal to materialize, Ethereum must not only clear major technical resistance barriers on surging volume, but it also requires a meaningful catalyst to shift the broader sentiment out of fear territory. Until such macroeconomic or network-specific catalysts emerge, ETH is expected to remain range-bound, highly sensitive to derivative market fluctuations, and perpetually vulnerable to retesting its lower support floors.