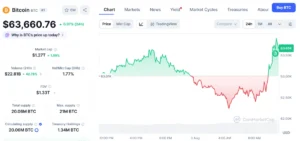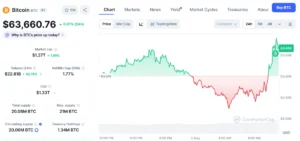
The intricate world of cryptocurrency forecasting, often a blend of technical analysis, market sentiment, and macroeconomic interpretation, frequently sees past predictions resurface when market movements begin to align with them. Such is the case with a Bitcoin roadmap initially shared by crypto commentator Klarck in February, which is now gaining renewed traction within the trading community. The renewed focus stems from Bitcoin’s recent price action, which has brought it perilously close to a key downside range – specifically the $65,000 to $55,000 region – that Klarck’s analysis had highlighted. This development underscores the dynamic nature of crypto markets and the often-cyclical re-evaluation of long-term technical projections.
Klarck’s February Forecast: A Detailed Retrospective
In February, a period marked by burgeoning optimism following the approval of spot Bitcoin Exchange-Traded Funds (ETFs) in the United States and the anticipation of the halving event, Klarck, an active voice in the crypto commentary sphere, published a detailed price roadmap for Bitcoin on X (formerly Twitter). This forecast, at a time when Bitcoin was already on a strong upward trajectory, outlined a multi-phase progression for the leading cryptocurrency.
The initial phase of Klarck’s projection called for a significant bounce, targeting a price point around $83,000. Following this peak, the roadmap anticipated a "gradual drop" into a specific downside zone, identified as the $65,000 to $55,000 range. Crucially, this projected decline was not seen as a capitulation but rather as a necessary correction and consolidation period. According to the roadmap, Bitcoin would then enter a "two-week accumulation phase" within this identified support region. This accumulation was expected to precede a "later transition back into growth," ultimately projecting an ambitious long-term target of $140,000 per Bitcoin.
It is imperative to note that this post is not recent market commentary but a historical snapshot from months prior. Its current relevance is not as a fresh trading signal but rather as an example of how market participants revisit and scrutinize older cycle maps when current price action begins to validate specific elements of the original prediction. The partial alignment of Bitcoin’s recent decline with the upper bound of Klarck’s projected downside range has reignited discussions, prompting traders and analysts to consider whether the subsequent phases of the roadmap might also materialize. This re-evaluation, while intriguing, necessitates a cautious approach, as market conditions are fluid and past correlations do not guarantee future outcomes.
The Current Market Juncture: Approaching the Critical Zone
Since Klarck’s February post, Bitcoin has experienced a volatile yet ultimately upward trajectory, albeit with significant corrections. In March, Bitcoin indeed surged to new all-time highs, reaching approximately $73,750, a strong rally but notably shy of Klarck’s $83,000 initial bounce target. This discrepancy highlights the inherent imprecision in price forecasting, even when the general direction aligns.
Following its peak, Bitcoin entered a phase of consolidation and correction, a common occurrence after significant rallies and particularly after halving events, which historically precede a period of re-pricing before a more sustained bull run. This corrective phase has seen Bitcoin’s price retreat, gradually moving closer to the $65,000 mark. The digital asset has tested this psychological and technical level multiple times, indicating its significance as a potential support zone.
The fact that Bitcoin has now entered the vicinity of the $65,000-$55,000 region outlined by Klarck months ago is what has drawn renewed attention to the forecast. This partial validation creates a compelling narrative, as it suggests a degree of foresight in identifying a critical inflection point. For many in the market, this convergence serves as a reminder that well-researched technical roadmaps, even if not perfectly accurate in every detail, can provide valuable reference points for understanding potential future price movements. It does not, however, confer infallibility on the entire prediction, particularly the more ambitious long-term targets.
Deconstructing the $65,000–$55,000 Support Zone

The immediate focus for market participants is not the aspirational $140,000 target but rather the robustness of the $65,000 to $55,000 zone. This range is critical from several technical and psychological standpoints:
- Previous Resistance Turned Support: In technical analysis, former resistance levels, once decisively broken, often transform into strong support zones. The $65,000-$69,000 area represented significant resistance during Bitcoin’s journey to new all-time highs. A retest of this region as support is a classic technical pattern.
- Psychological Significance: Round numbers like $65,000 and $55,000 hold inherent psychological weight for traders, often acting as magnets for price action and points where large buy or sell orders are clustered.
- Fibonacci Retracement Levels: When analyzing a significant price move, Fibonacci retracement levels (e.g., 0.382, 0.5, 0.618) often identify potential areas of support or resistance. A deeper analysis might reveal that the $65,000-$55,000 zone aligns with key retracement levels from the rally originating in late 2023 or early 2024, reinforcing its technical importance. For instance, a 0.382 or 0.5 retracement of the move from the mid-$30,000s to the $73,000s could easily fall within this range.
- Moving Averages: Key moving averages, such as the 50-day, 100-day, or 200-day Simple Moving Averages (SMAs) or Exponential Moving Averages (EMAs), often converge around significant support levels. A sustained break below these averages can signal a shift in market trend, while holding them can confirm bullish momentum. The $65,000-$55,000 zone likely encompasses or is proximate to several of these important trend indicators on various timeframes.
- Volume Profile Analysis: Areas where significant trading volume has occurred in the past (volume nodes) often act as strong support or resistance. The $60,000-$69,000 range, having been a battleground for bulls and bears during previous cycles and the recent ascent, contains substantial volume, lending it structural integrity.
Scenarios for the Critical Zone:
-
Stabilization and Accumulation: If Bitcoin manages to stabilize within the upper bounds of this $65,000-$55,000 region, the roadmap’s predicted "accumulation phase" becomes the next critical component to observe. This phase would typically be characterized by a reduction in selling pressure, a tightening of the trading range, and an increase in buying interest, often from long-term holders and institutional players. Signs of accumulation include:
- Reduced Volatility: Price action becoming less erratic, forming a narrower range.
- Higher Lows: The asset consistently finding support at increasingly higher price points within the range.
- Volume Dynamics: Decreased selling volume on price dips, and increased buying volume on attempts to break out of the range.
- On-Chain Metrics: A potential increase in accumulation by long-term holders, as evidenced by metrics like rising "HODL waves" or declining exchange balances, suggesting coins are being moved off exchanges into cold storage.
If these conditions materialize, it would lend further credence to Klarck’s roadmap and set the stage for a potential resumption of growth.
-
Failure to Hold and Deeper Retracement: Conversely, if Bitcoin fails to establish strong support at the upper end of the $65,000-$55,000 zone, market participants would likely shift their focus to the lower end of the range, specifically around $55,000. A decisive break below $65,000, especially accompanied by high selling volume, could signal a more significant downward correction. In such a scenario, $55,000 would become the next major liquidity target. Liquidity targets are price levels where a large number of stop-loss orders or liquidation points for leveraged positions are concentrated. When these levels are breached, they can trigger cascading sell-offs, accelerating the price decline. A fall to $55,000 would represent a substantial retracement from Bitcoin’s all-time highs, potentially testing the resolve of many investors and recalibrating market expectations.
Broader Market Context and Influencing Factors
The trajectory of Bitcoin, and by extension the validation of any roadmap, is not solely determined by technical patterns but by a confluence of macroeconomic, geopolitical, and specific crypto-market factors.
- Macroeconomic Environment: Global economic conditions, particularly inflation rates, central bank monetary policies (e.g., Federal Reserve interest rate decisions), and the strength of the U.S. dollar, exert significant influence on risk assets like Bitcoin. Higher interest rates typically reduce the appeal of speculative assets, while easing policies can foster a risk-on environment. Recent inflation data and central bank rhetoric will play a pivotal role in shaping investor sentiment in the coming months.
- Spot ETF Flows: The approval of spot Bitcoin ETFs in January ushered in a new era of institutional capital inflow. While initial months saw unprecedented demand, the pace of inflows has fluctuated, with occasional net outflows, particularly from the Grayscale Bitcoin Trust (GBTC). Sustained net inflows from these vehicles are crucial for maintaining upward price pressure, whereas significant outflows could signal waning institutional interest.
- Bitcoin Halving Impact: The quadrennial Bitcoin halving event, which occurred in April, historically reduces the supply of new Bitcoin entering the market. While halvings have often been precursors to bull runs, the immediate aftermath typically involves a period of consolidation or even a temporary dip, as the market digests the supply shock and miners adjust. The current price action aligns with some historical post-halving consolidation patterns.
- Regulatory Landscape: Evolving regulatory frameworks globally, from positive developments in certain jurisdictions to increased scrutiny in others, can impact investor confidence and market liquidity. Clearer regulations often attract more institutional participation, while uncertainty can deter it.
The Art and Peril of Forecasting in Dynamic Markets
The resurgence of Klarck’s old roadmap serves as a compelling case study in the cyclical nature of market memory and the human tendency to seek patterns. While technical analysis provides valuable tools for understanding market structure and potential trajectories, it is not an exact science.
- Why Old Forecasts Resurface: Traders and investors are constantly searching for predictive models. When a segment of an old forecast aligns with current price action, it creates a powerful psychological effect, leading to confirmation bias and a renewed belief in the entire projection. It’s an attempt to find order in inherently chaotic systems.
- The Dangers of Over-Reliance: Markets are dynamic, influenced by an infinite number of variables that can shift rapidly. Macroeconomic shocks, unexpected regulatory changes, or unforeseen geopolitical events (often termed "black swan" events) can invalidate even the most meticulously crafted technical roadmaps. Relying solely on an old forecast without continuously assessing current market conditions and adapting to new information is a perilous strategy.
- Reference Point vs. Trading Plan: The critical distinction to make is that such forecasts should serve as a reference point for analysis, not a rigid trading plan. They can help frame potential price levels and scenarios, but they require continuous validation from current price action, volume analysis, on-chain data, and fundamental developments. A robust trading strategy incorporates multiple analytical methods, strict risk management, and adaptability.
- Analyst Credibility and Due Diligence: The crypto space features a wide spectrum of commentators, from seasoned financial analysts to speculative influencers. Users must exercise due diligence, evaluating the track record, methodology, and potential biases of any source. Klarck’s forecast, while gaining attention, is still a prediction by an individual commentator, not an institutional research report.
Implications for Traders and Investors
For both short-term traders and long-term investors, the current situation presents a moment for careful consideration:
- Risk Management: For traders, understanding the potential support levels outlined in such roadmaps can inform the placement of stop-loss orders and profit targets, but these must be actively managed based on real-time market movements. Position sizing and diversification remain paramount.
- Emotional Discipline: The allure of a seemingly validated long-term roadmap can lead to emotional trading, whether it’s FOMO (Fear Of Missing Out) on a potential rally or FUD (Fear, Uncertainty, Doubt) if the market breaks below expected support. Maintaining emotional discipline and adhering to a predefined strategy is crucial.
- Long-Term Perspective: For long-term investors, corrections into strong support zones can be viewed as accumulation opportunities, assuming the fundamental thesis for Bitcoin remains intact. However, even long-term holders benefit from understanding potential downside risks.
- The Role of News and Sentiment: The very act of such an old roadmap resurfacing in news and social media can itself influence market sentiment, creating a self-fulfilling prophecy to some extent, as more participants become aware of and react to the identified levels.
In conclusion, Klarck’s February Bitcoin roadmap, with its compelling foresight regarding the $65,000-$55,000 downside zone, has re-entered the market conversation at a critical juncture. Bitcoin’s current proximity to this zone validates a significant portion of the original prediction, inviting scrutiny into the potential for the roadmap’s subsequent phases, including the projected accumulation and the ambitious $140,000 target. However, the highly volatile and complex nature of the cryptocurrency market demands that such forecasts be treated as valuable reference points rather than infallible blueprints. The market’s reaction to the $65,000-$55,000 region in the coming weeks will undoubtedly be a pivotal determinant for Bitcoin’s near-term trajectory and the ultimate credibility of Klarck’s months-old projection.