Stellar (XLM) has demonstrated a notable resurgence across cryptocurrency markets, registering an 8.2% price increase over a 24-hour window. According to market data aggregation platforms, this upward price movement was accompanied by a dramatic expansion in market activity, highlighted by a 221% surge in daily trading volume. The sudden spike in liquidity points to renewed speculative interest and institutional attention directed toward the prominent altcoin, which has historically functioned as a foundational layer for cross-border payments and asset tokenization.
Derivatives and spot market indicators suggest that this price appreciation is backed by substantial capital inflows rather than superficial retail hype. Market observers note that the broader cryptocurrency ecosystem has been navigating a delicate macroeconomic environment, making isolated breakouts in established altcoins like XLM particularly noteworthy for traders assessing sector-wide momentum shifts.

Market Dynamics: Derivatives and Spot Activity Driving the Rally
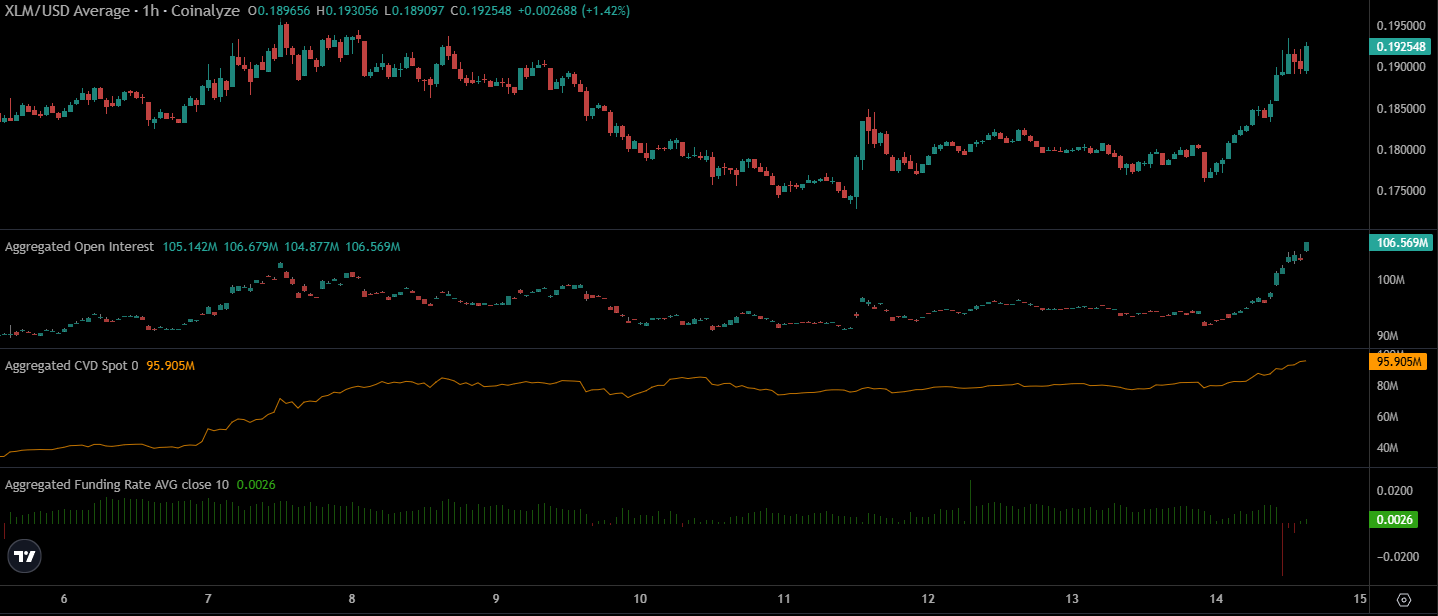
The recent 8.2% rally in Stellar’s native token was not an isolated price anomaly; it was heavily supported by underlying structural changes in derivatives data. Coinalyze metrics reveal that Open Interest (OI) for XLM surged by 14.4% over the same 24-hour period, indicating that fresh capital is actively entering derivative contracts. A rising Open Interest, paired with a rising spot Cumulative Volume Delta (CVD), typically signifies strong buyer conviction and aggressive positioning by market participants.
Interestingly, Coinalyze data also highlighted a brief dip of funding rates into negative territory during the initial stages of the breakout. Rather than signaling a broader market downturn, this temporary negative funding rate revealed that aggressive traders attempted to short the asset near the local resistance level of $0.184. These short-sellers were quickly squeezed as bullish momentum overpowered their positions, resulting in liquidations that further fueled the upward price trajectory. This dynamic illustrates the robust underlying demand supporting XLM as it tests critical technical thresholds.
Technical Analysis: Defending the $0.173 Support and Targeting Higher Resistance
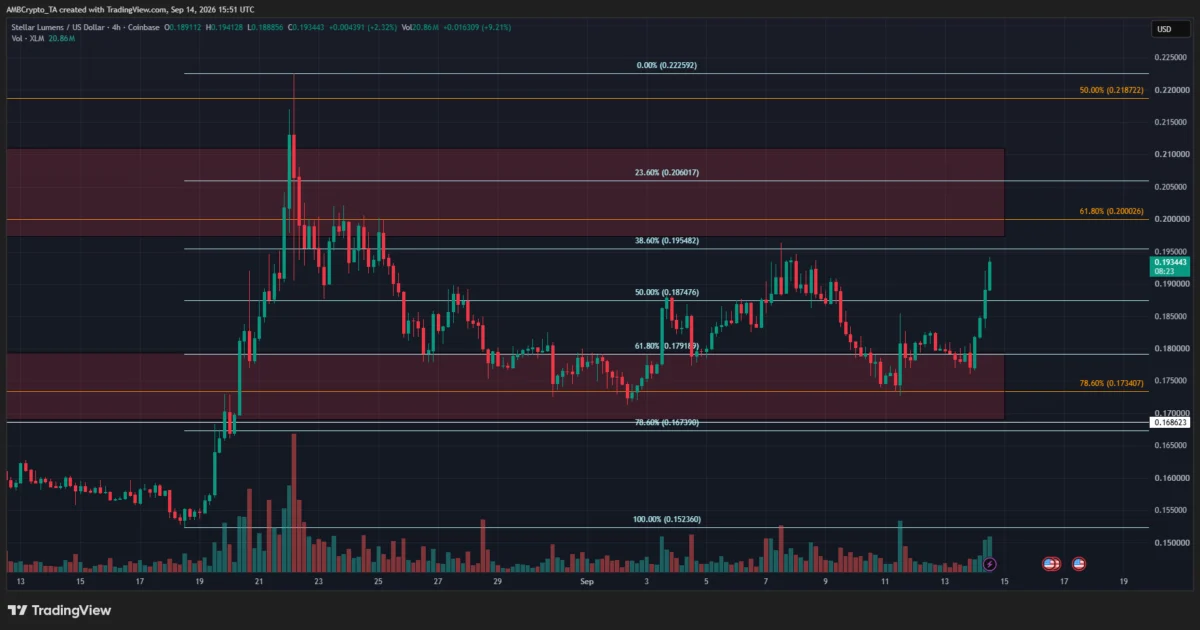
From a technical perspective, XLM continues to maintain a bullish swing structure on the daily timeframe. Fibonacci retracement levels indicate that the $0.173 price point—representing the crucial 78.6% retracement level—has acted as a dependable foundation. Throughout September, this zone has been tested multiple times, and each test has been met with aggressive defense by buyers, cementing its status as a robust accumulation area.
Despite the bullish daily structure, analysts emphasize that XLM remains confined within a broader local trading range between $0.173 and $0.195 on the four-hour (H4) timeframe. To sustain the ongoing uptrend, the asset must decisively break through the immediate supply zone positioned at $0.195. Beyond that barrier lies the highly anticipated psychological and technical resistance zone between $0.20 and $0.21.
Market liquidation heatmaps sourced from CoinGlass underscore the $0.20 threshold as a critical magnetic zone. Given the current velocity of bullish momentum, a test of this supply zone appears increasingly probable. However, analysts caution that the sustainability of this move depends heavily on persistent demand within both spot and derivatives markets. Should the price surge rapidly into the $0.20–$0.21 zone on dwindling volume, it could merely represent a liquidity sweep before a sharp corrective pullback toward the $0.17 support floor.
Historical Context and Background of Stellar’s Market Position
To fully understand Stellar’s current market behavior, it is essential to examine the asset’s broader trajectory over recent months. Earlier in the year, market analysts pointed out a protracted bearish long-term trend for XLM, even as fundamental developments surrounding the Stellar network continued to progress. Major financial entities and payment processors—including recent collaborations involving legacy remittance networks and distributed ledger technology infrastructure providers like the Depository Trust and Clearing Corporation (DTCC) and MoneyGram—have periodically chosen Stellar’s blockchain for high-efficiency settlement experiments and cross-border capabilities.
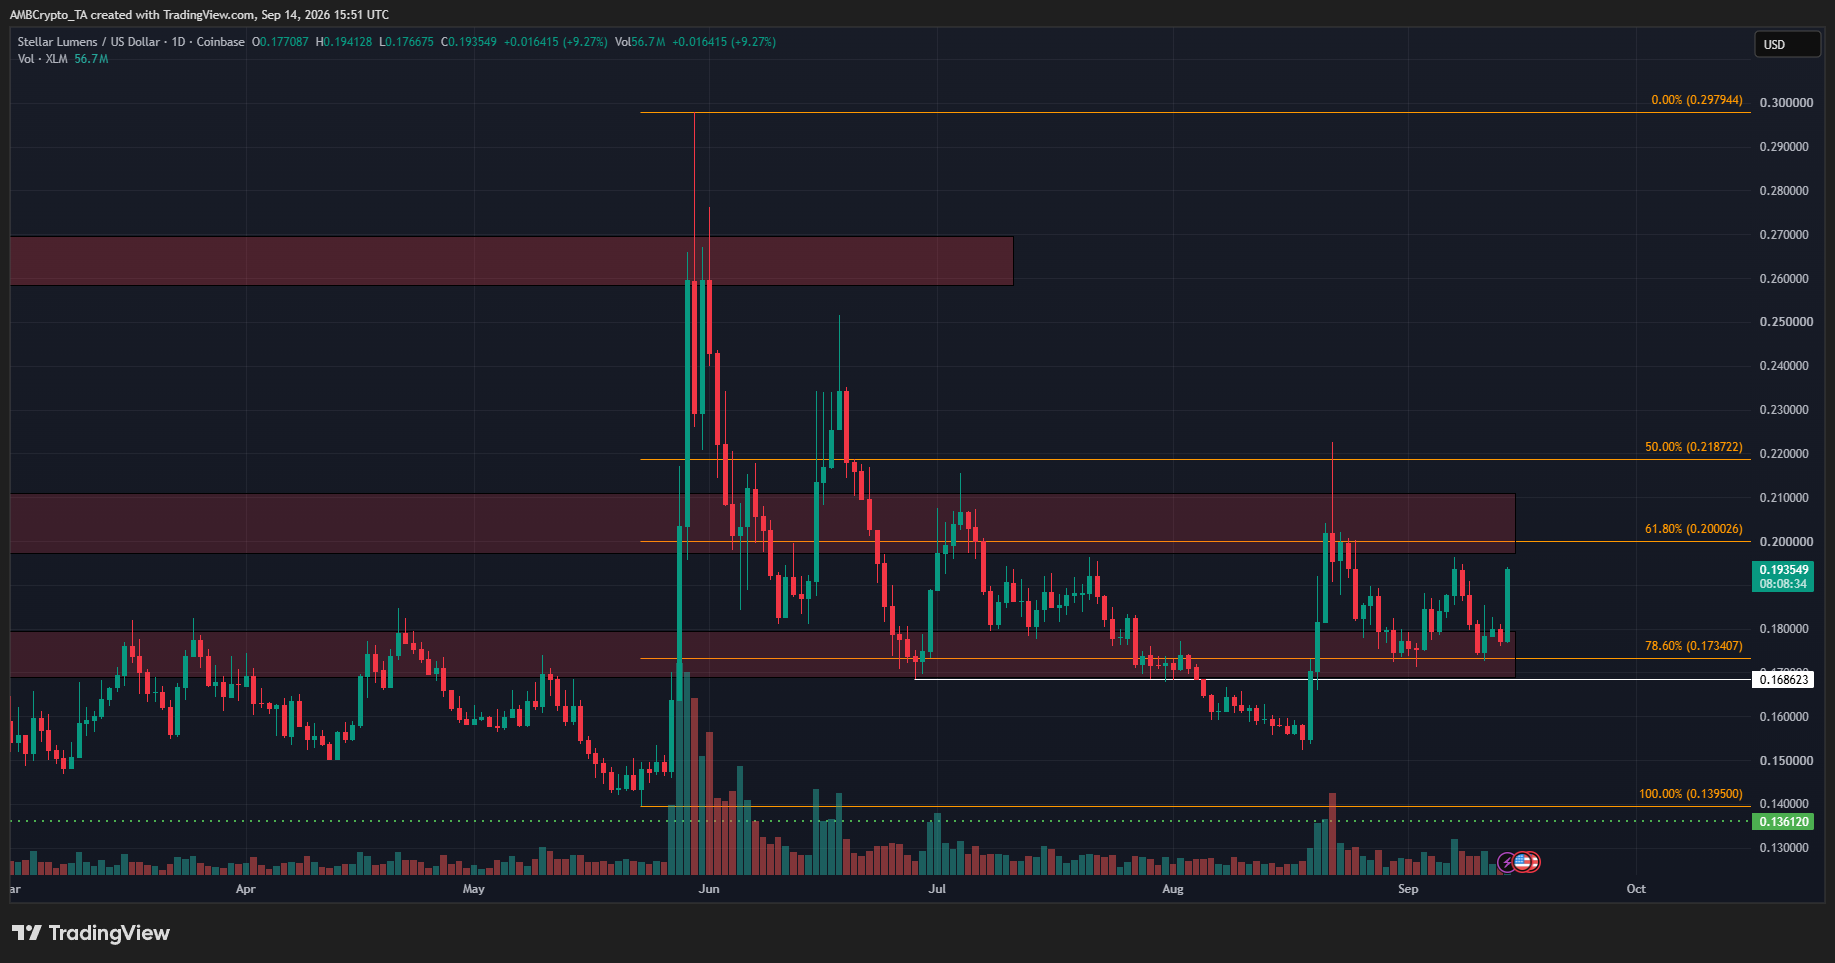
Despite these fundamental integrations, XLM’s price action has occasionally lagged behind broader speculative altcoin cycles, leading to prolonged consolidation phases. The recent June-to-September price action has consistently oscillated within defined supply and demand corridors, specifically respecting the lower bounds near $0.17 and upper limits approaching $0.20. The current September surge represents an attempt by market participants to break out of this multi-month accumulation range and establish a new macro trend.
Implications for Traders and Broader Market Outlook
The intersection of soaring trading volume, rising Open Interest, and aggressive short-squeezing places XLM at a crucial crossroads. For active traders, the prevailing market consensus advises patience, advocating for a confirmed breakout above the $0.195–$0.20 range rather than chasing green candles inside the current range.
If spot buyers continue to absorb available supply and successfully clear the $0.21 resistance barrier, XLM could open the door for a more sustained medium-term recovery, alleviating the downward pressure that has characterized its long-term charts. Conversely, a failure to break above the overhead supply zones could trap late-stage buyers, leading to a liquidity hunt that pushes prices back toward the well-defended $0.17 support foundation. As September progress, market participants will monitor order book depths, funding rates, and volume consistency to gauge whether Stellar’s latest rally marks the beginning of a true trend reversal or merely another temporary relief bounce within a larger sideways channel.