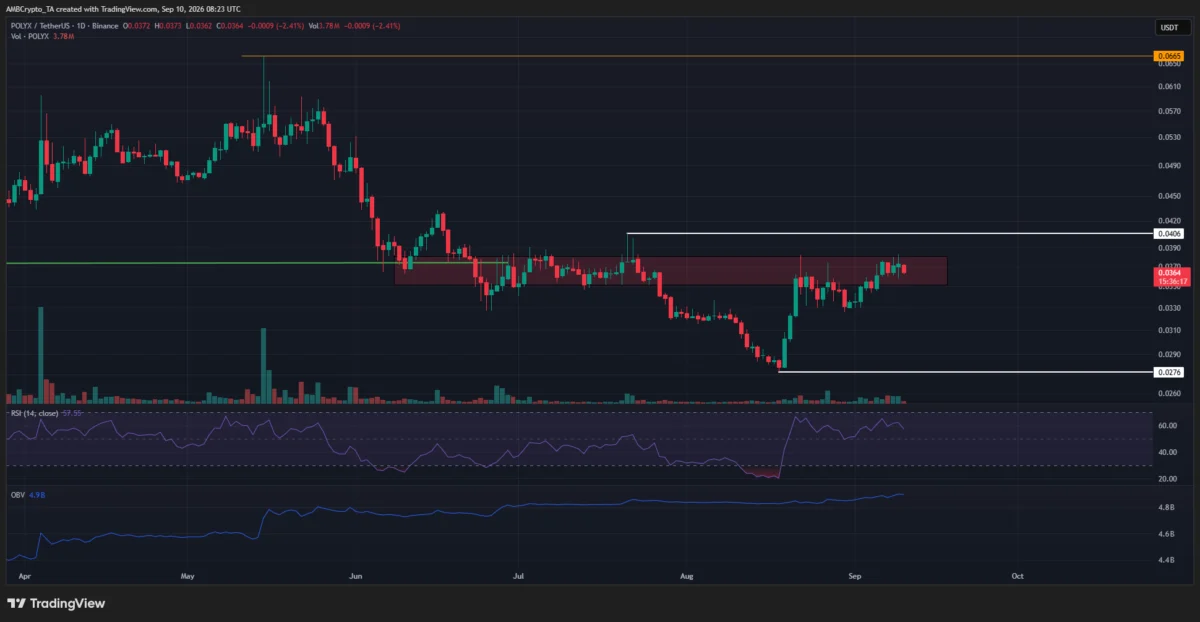
The cryptocurrency market is constantly navigating periods of intense volatility, shifting investor sentiment, and evolving regulatory landscapes. Among the myriad altcoins vying for market share and investor attention, Polymesh (POLYX)—frequently marketed as a specialized blockchain purpose-built for real-world assets (RWAs)—has recently experienced a minor price correction, shedding nearly 4% over a 24-hour window. However, this localized pullback follows a resilient 30-month-to-date bounce of roughly 16.6%, sparking renewed industry discussions regarding a potential broader bullish recovery. As institutional interest in tokenized real-world assets grows, the performance of infrastructure-focused protocols like Polymesh serves as an important barometer for sector-wide health.
Market Context and Broader Cryptocurrency Sentiment
The trajectory of alternative cryptocurrencies like POLYX is rarely isolated; it is intimately tied to the macroeconomic climate and the performance of bellwether digital assets such as Bitcoin (BTC) and Ethereum (ETH). Following robust capital inflows and strong bullish momentum throughout August, the broader digital asset market has experienced a period of digestion and consolidation.
Recent market movements saw Bitcoin retesting the critical $77,000 support zone. Market analysts and macroeconomic strategists are closely monitoring whether this price action represents a healthy retracement within an ongoing bull market or the precursor to a deeper correction. Historically, a resilient Bitcoin that successfully defends major technical support levels instills confidence across the wider ecosystem. This confidence typically trickles down into altcoin markets, improving risk appetite for specialized layer-1 and layer-2 solutions, including Polymesh.
The intersection of institutional finance and blockchain technology has placed tokenized real-world assets in the spotlight. Assets ranging from real estate and equities to private debt and commodities are increasingly being migrated onto distributed ledgers to enhance liquidity, transparency, and settlement speed. Polymesh was specifically architected to address the regulatory and compliance hurdles inherent in RWA tokenization—features such as built-in identity verification, compliance controls, and asset-level restrictions. Despite these foundational advantages, POLYX’s native token has not been immune to macroeconomic headwinds and broader crypto market cycles.

Chronological Review of POLYX Price Action
To understand Polymesh’s current market standing, it is necessary to examine the historical price chronology that has shaped its present technical structure.
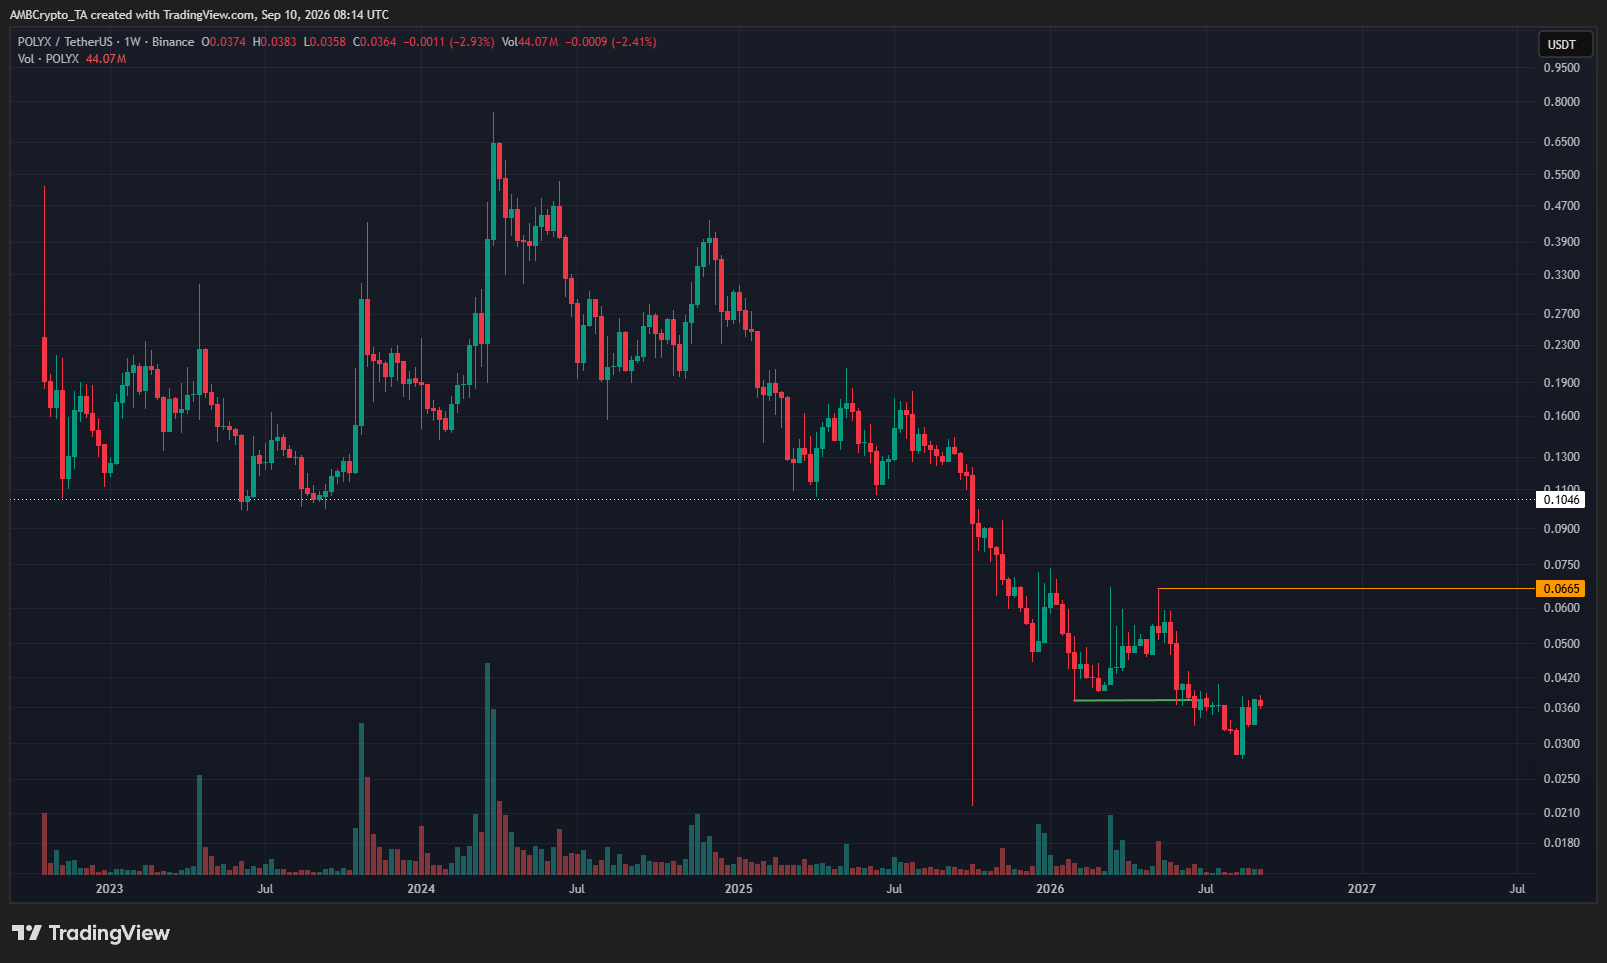
Between 2023 and mid-2025, the $0.10 price threshold acted as a formidable support zone for POLYX, absorbing numerous downward pressures and providing a reliable base for accumulation. However, as broader macroeconomic pressures and crypto-specific market cycles intensified, the asset succumbed to a wider downtrend. By October 2025, the onset of a pronounced bear market cycle broke historical supports, shifting the token’s weekly swing structure firmly into bearish territory.
In the months following the initial breakdown, POLYX experienced lower highs and lower lows, standard characteristics of a sustained bear market. A temporary reprieve occurred in May, when the altcoin established a swing high at $0.0665. This level now stands as a primary structural ceiling. More recently, the previous swing low of $0.518 has transformed into a critical overhead resistance area. Although bulls have attempted to mount localized recoveries from multi-year lows, the overarching macro trend on higher timeframes remains decidedly bearish until key structural barriers are convincingly broken.
Technical Analysis: Weekly and Daily Chart Dynamics
Recent analytical commentary shared by prominent crypto market observers, including the widely followed analysis account World of Charts on X, has brought renewed attention to POLYX’s technical outlook. Utilizing a 3-day logarithmic chart with the simple caption "getting ready," the analysis highlighted a potential setup for trend reversal, capturing the interest of momentum traders and swing investors alike.
A granular look at the weekly POLYX/USDT charts reveals the immense hurdles facing a long-term bullish continuation. The primary resistance level preventing a structural flip to the bullish side is situated at the May swing high of $0.0665. Until buyers can decisively push the token above this threshold, rallies are largely categorized as relief bounces within a broader corrective phase. Furthermore, the previous swing low at $0.0518 is currently acting as immediate resistance, creating a narrow corridor that price action must navigate.
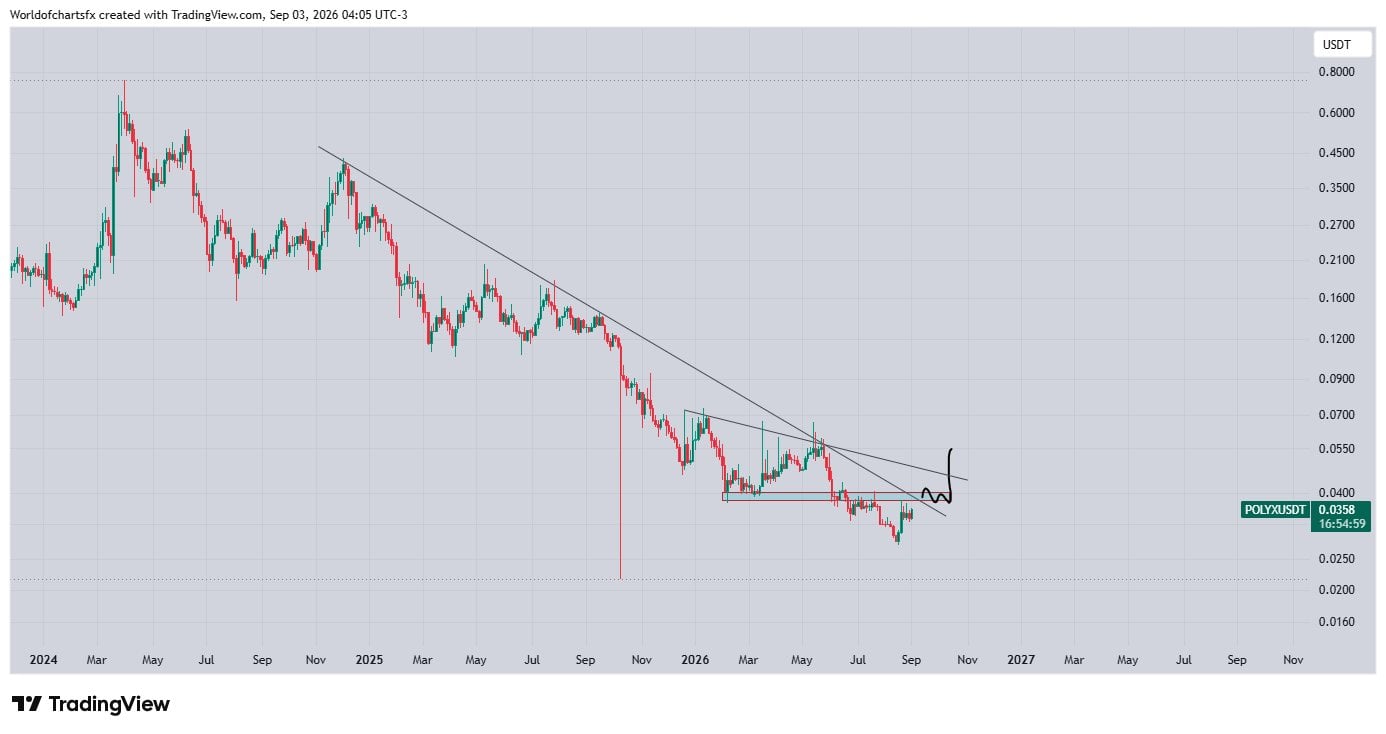
On the daily timeframe, the technical picture exhibits similar complexities. The 1-day swing structure displays key structural points at $0.0406 and $0.0276. While POLYX has managed to trade closer to its recent local highs, the vital supply zone at $0.037 has yet to be breached with conviction. A failure to clear this supply zone could invite renewed selling pressure, potentially dragging the token back toward multi-month support levels.
Key Indicators: RSI and On-Balance Volume (OBV) Provide Mixed Signals
Despite the overarching bearish macro structure, several technical indicators are offering glimmers of hope for market participants anticipating a reversal.
The daily Relative Strength Index (RSI), a widely utilized momentum oscillator, currently registers a reading of 57. This positioning indicates that upward momentum is actively building, placing the token safely above the neutral 50 centerline without yet entering overbought territory. This provides room for further price appreciation before technical exhaustion sets in.
More compellingly, the On-Balance Volume (OBV) indicator has displayed a consistent upward trajectory since August, even during periods when the spot price of POLYX experienced downward pressure or consolidation. In technical analysis, a rising OBV amid a flat or declining price suggests a positive divergence. This divergence implies that accumulation is actively taking place behind the scenes—meaning buying volume has systematically exceeded selling volume over the observation period.
Market analysts note that while buyers have not yet demonstrated aggressive conviction, the quiet accumulation reflected in the OBV significantly enhances the probability of a sharp bullish trend shift should broader market conditions turn favorable.
Broader Impact and Market Implications
The current predicament of Polymesh underscores the complex reality facing utility-driven altcoins in the current market cycle. Even protocols with clear value propositions, robust compliance frameworks, and targeted real-world utility are heavily influenced by the macroeconomic tides dictated by Bitcoin and Ethereum.
For institutional stakeholders, developers, and retail investors alike, the primary takeaway is the importance of patience and risk management. While indicators like the OBV point toward quiet accumulation and technical setups suggest a potential coiled-spring effect, confirming a genuine trend reversal requires objective validation. Specifically, bulls must recapture key structural resistance levels—such as the $0.0518 zone on the weekly chart and the $0.037 supply area on the daily timeframe—before a sustained recovery can be validated.
As the tokenization of real-world assets continues to mature as a narrative within the financial technology sector, the underlying infrastructure supporting these networks will remain under close observation. Whether Polymesh can leverage its technical divergences to break free from its historical downtrend will depend heavily on sustained buying volume, broader crypto market stability, and the continued adoption of compliant blockchain solutions.