The digital asset ecosystem witnessed renewed activity as the Canton [CC] token experienced a notable 8.8% price rally over a recent 24-hour window, attempting to recover from a minor 2% weekly contraction. This sudden upward momentum has drawn the attention of market analysts and technical traders alike, who have been monitoring the asset’s price compression near critical historical demand zones. The recent price action coincides with broader institutional milestones for the underlying Canton Network infrastructure, notably a successful intraday repurchase agreement (repo) settlement executed by post-trade workflow automation firm Tokenovate. As market participants dissect the confluence of technical chart patterns and fundamental network developments, questions remain regarding whether the CC token can sustain its current bullish reversal or if it will remain confined to its multi-month trading range.
Technical Analysis and Price Compression at Psychological Support
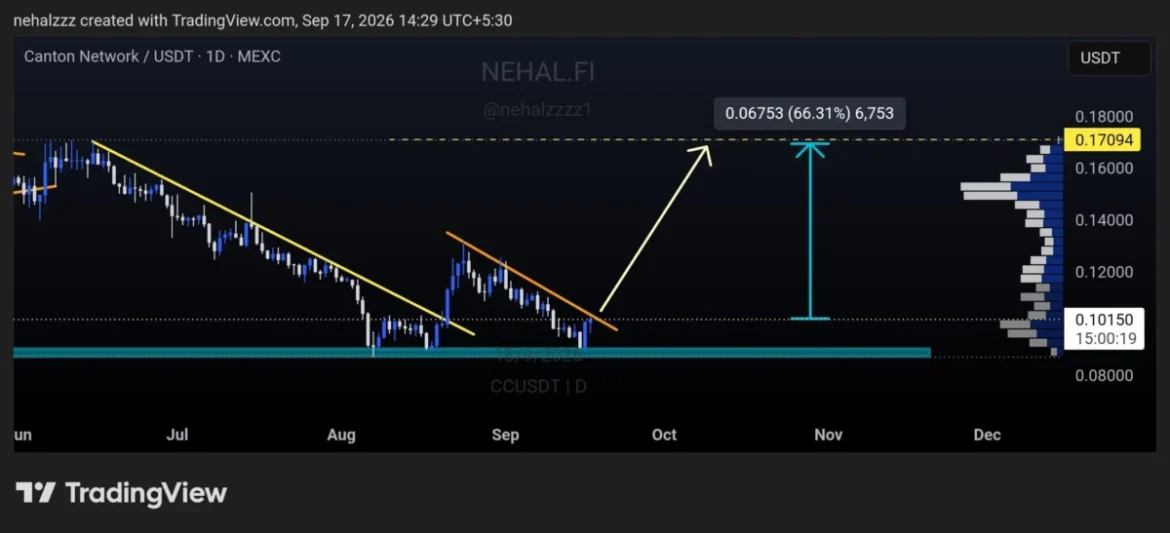
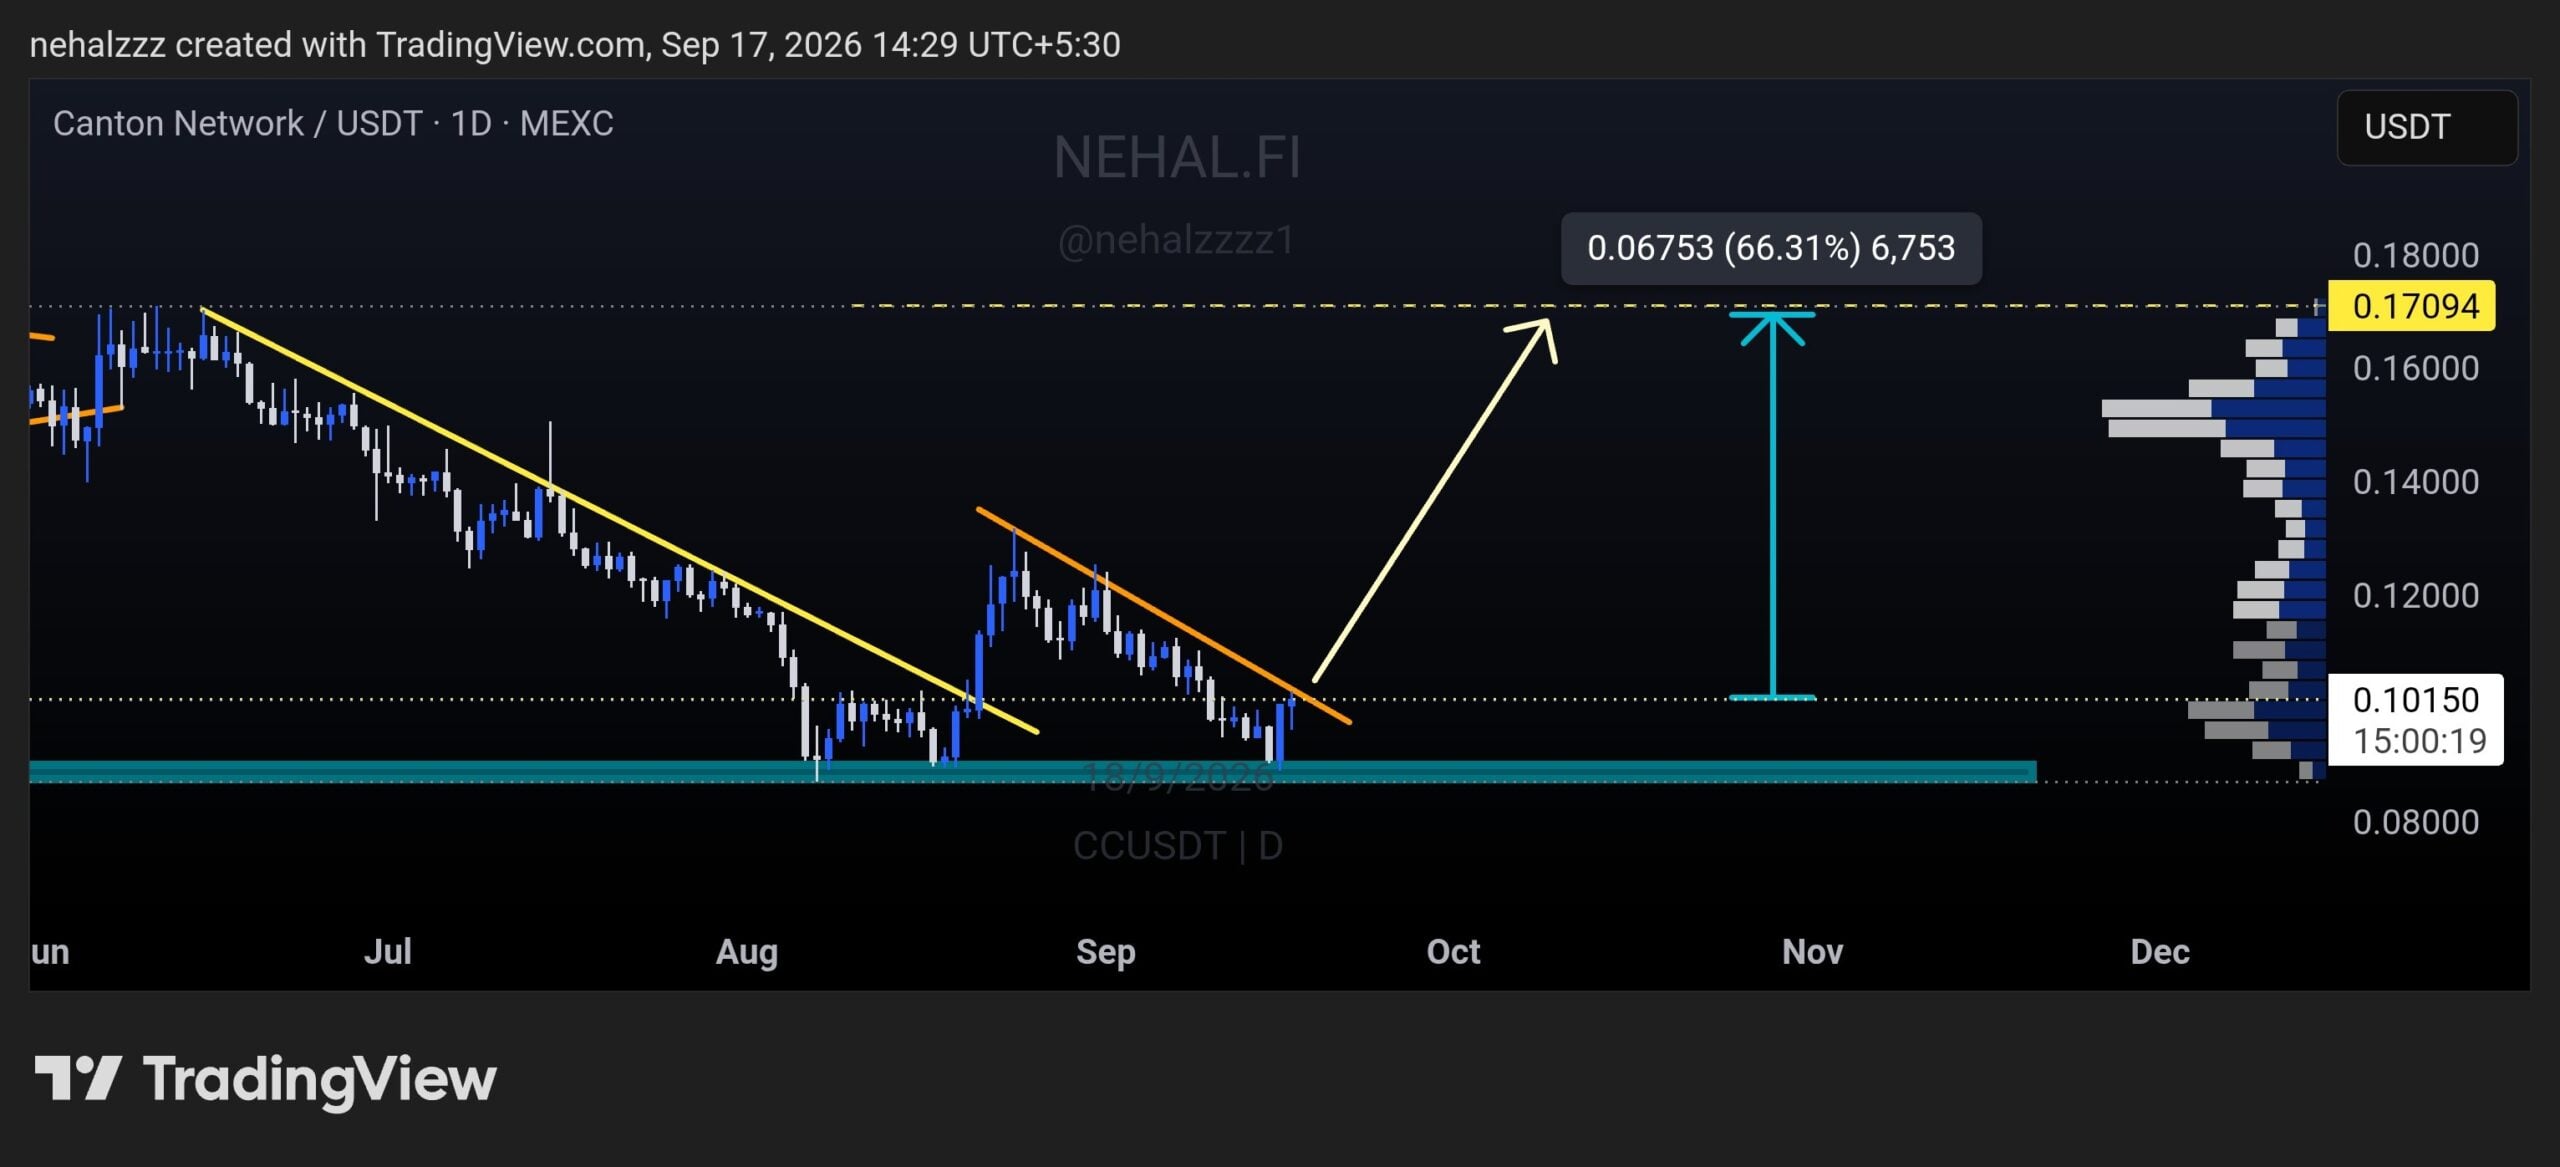
Over the past six weeks, the price of the CC token has been systematically compressing within a descending trendline resistance channel. This consolidation phase has primarily centered around the psychological round-number demand zone spanning from $0.09 to $0.10. Market analysts observing the asset on social media platforms highlighted that this specific price bracket has historically functioned as a robust support level, successfully absorbing selling pressure during broader market downturns.
The recent 8.8% intraday surge—complemented by a broader 10.9% bounce mid-week—underscores a strengthening conviction among buyers defending these critical range lows. Prominent charting perspectives suggest that if the CC token successfully achieves a confirmed bullish breakout above its descending resistance line, the ensuing expansion could unlock a significant upward trajectory, with theoretical projection models indicating a potential rally of up to 66%. However, reaching such ambitious targets requires overcoming immediate local supply barriers that have previously capped explosive upward movements.

Chronology of Price Action and Macro Range Dynamics
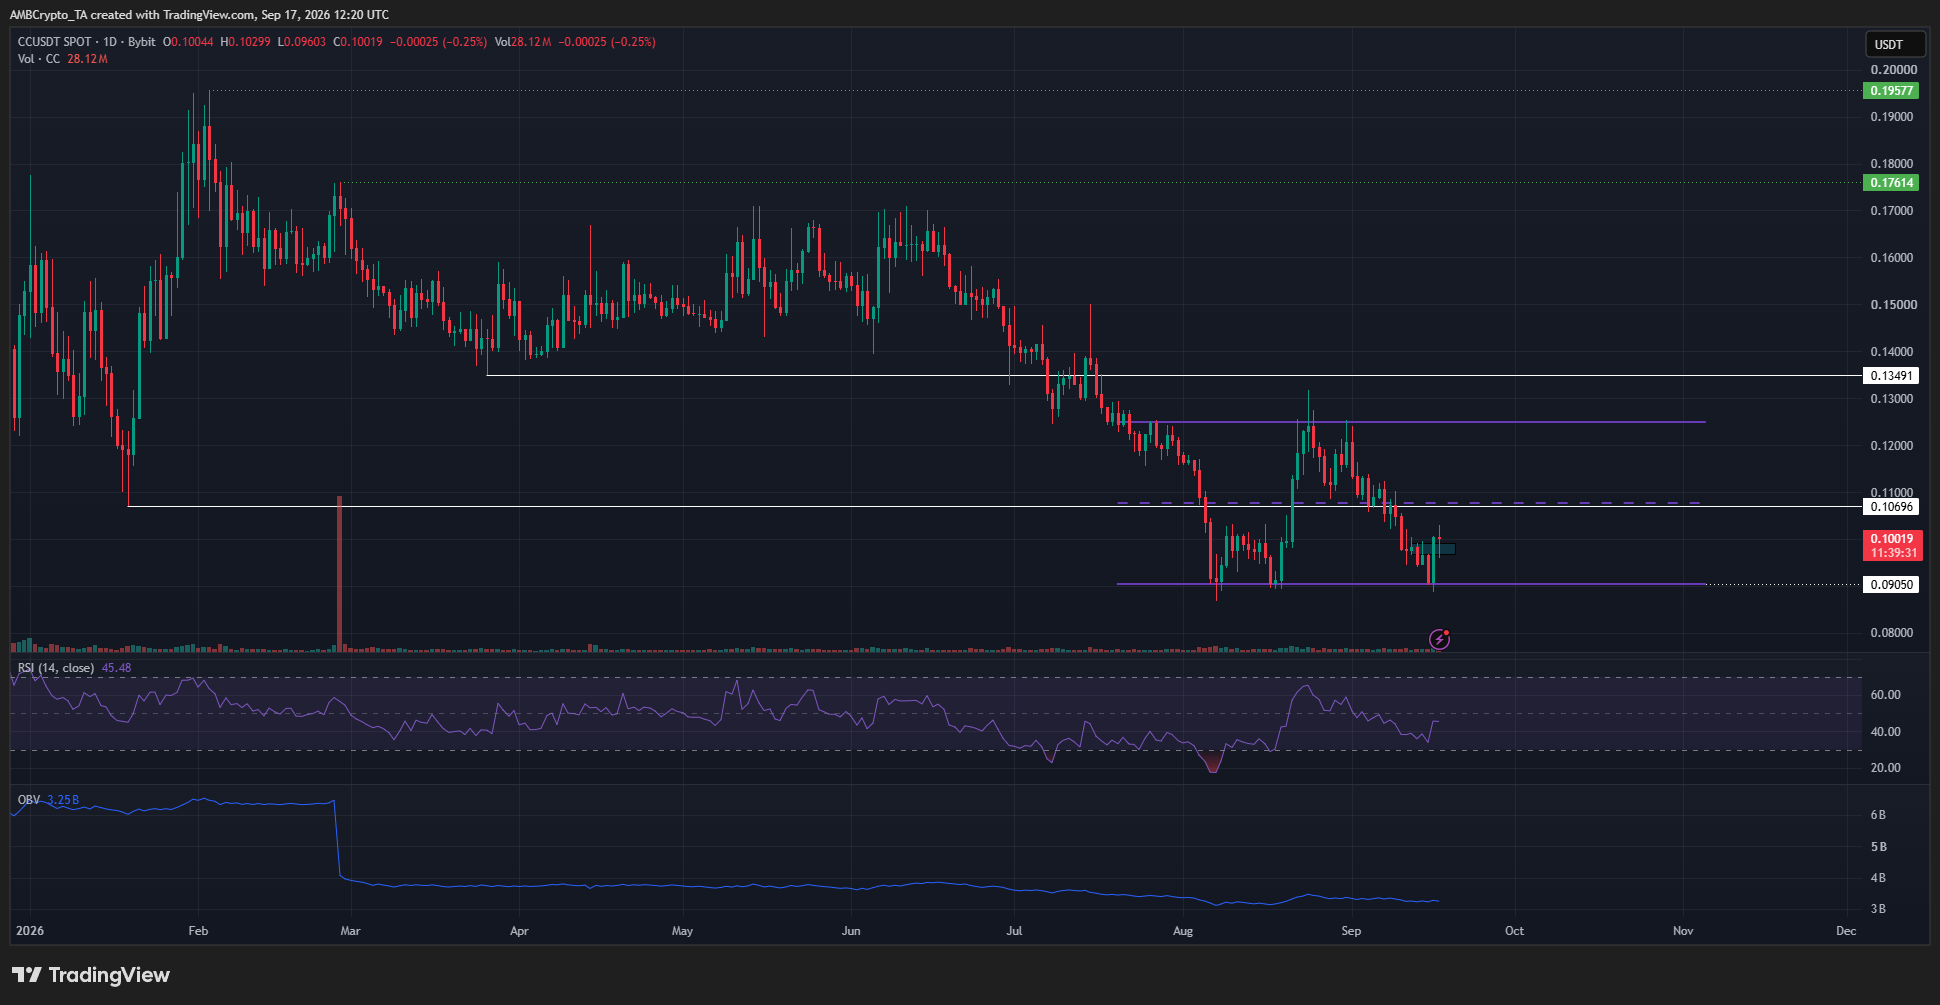
To understand the current standing of the Canton token, it is necessary to examine the macro price structure established throughout the year. In March, CC demonstrated relative strength by maintaining a vital support floor at $0.135. However, as broader macroeconomic headwinds and shifting liquidity trends impacted the alternative coin sector in July, the token decisively breached this threshold.
The downward trajectory accelerated when CC broke below the crucial $0.107 low established in January, signaling a macro structural shift toward a bearish higher-timeframe framework. Since mid-July, the asset’s price action has transitioned from a definitive downtrend into a structured consolidation range, bound between a lower boundary of $0.09 and an upper boundary of $0.125. The mid-range equilibrium point hovers just above the previously breached $0.107 mark, acting as a gravitational center for the token’s daily fluctuations.
With the multi-touch defense of the $0.09 support level now validated on multiple occasions, swing traders and institutional observers are positioning themselves for potential mean reversion moves. A logical first target for the current bullish impulse is the range high of $0.125, representing a potential 25% appreciation from prevailing market valuations.
Volume Dynamics, Indicators, and Short-Term Momentum
Evaluating internal market metrics provides further clarity on the sustainability of the current rally. Over the course of September, On-Balance Volume (OBV) data indicated a steady, persistent downtrend, reflecting a broader cooling of retail and institutional capital inflows. However, the accumulation of buying pressure over a recent 36-hour window has begun to challenge this narrative, hinting at an impending structural shift in volume metrics.
On shorter timeframes, such as the 2-hour trading charts, technical indicators have begun flashing bullish signals. The Relative Strength Index (RSI) has demonstrated strong upward momentum, moving away from oversold conditions and registering higher lows. Furthermore, CC has successfully cleared a local supply zone situated between $0.097 and $0.099. This clearance removes an immediate friction point, allowing the asset to test higher resistance ceilings. The alignment of momentum oscillators across multiple timeframes suggests that buyers are gradually regaining control of the short-term market narrative.
Institutional Integration and Network Infrastructure Milestones
While technical charts provide a roadmap for price action, fundamental developments within the Canton Network ecosystem continue to shape the token’s long-term value proposition. In parallel with the recent market activity, Tokenovate—a prominent post-trade workflow automation company—announced a significant operational milestone on the network.
Tokenovate successfully executed and settled an intraday repurchase agreement (repo) utilizing the Canton Network infrastructure. The transaction leveraged tokenized USDC alongside the International Swaps and Derivatives Association (ISDA) and Fintech Open Source Foundation (FINOS) Common Domain Model to fully automate the trade lifecycle. This milestone demonstrates the practical utility of the Canton Network in handling complex, institutional-grade financial transactions with heightened efficiency, transparency, and reduced settlement risk.
Market Implications and Future Outlook
The intersection of technical resilience and real-world institutional adoption places the Canton Network and its native CC token in a unique position within the digital asset landscape. From a trading perspective, the successful defense of the macro range low provides a defined risk parameter for market participants, with invalidation levels clearly demarcated beneath the $0.09 threshold.
For broader market observers, the ability of the network to facilitate sophisticated financial instruments like automated intraday repos highlights the ongoing maturation of enterprise-grade blockchain infrastructure. Whether the current technical breakout will trigger the projected 66% rally depends heavily on sustained volume inflows, broader macroeconomic crypto market conditions, and the continued integration of traditional financial workflows onto decentralized rails. As CC tests the upper boundaries of its established range, market participants will monitor order books closely for confirmation of a lasting trend reversal.


![Onyxcoin [XCN] rallies 20% after neobank vote – What comes next? - AMBCrypto](https://ambcrypto.com/wp-content/uploads/2026/09/FI_PA.PP_ONYX_CRYPTO_09-09-2026.webp)
![Onyxcoin [XCN] rallies 20% after neobank vote – What comes next? - AMBCrypto](https://ambcrypto.com/wp-content/uploads/2026/09/XCNUSDT_2026-09-09_08-08-00-scaled.png)