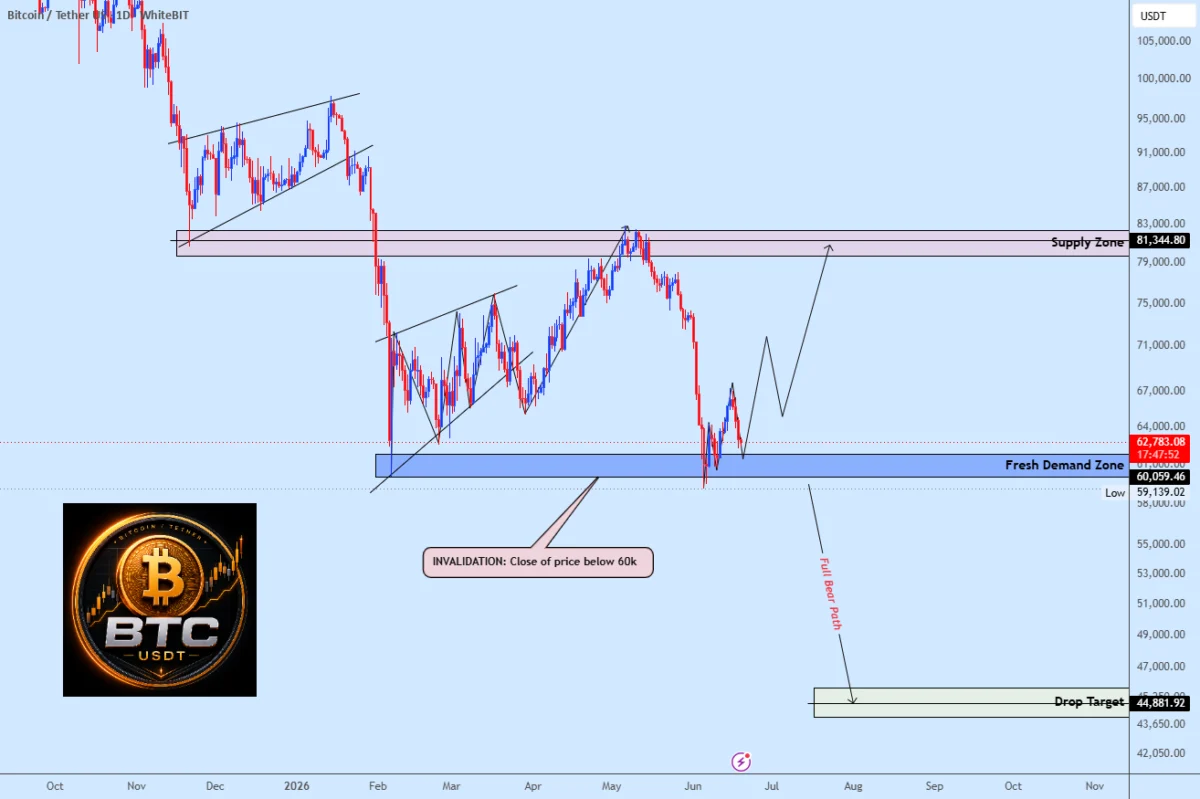
Bitcoin is currently navigating a pivotal juncture as it tests the $60,000 threshold, a price point that market analysts identify as both a psychological anchor and a significant technical demand zone. According to recent market analysis from TradingView contributor weslad, this specific price level serves as a primary determinant for the asset’s short-term future. The current market environment reflects a high-stakes standoff between buyers attempting to solidify a floor and sellers testing the resolve of the bullish narrative that has characterized much of the recent fiscal year.
The significance of the $60,000 mark cannot be overstated, as it represents the intersection of historical liquidity and current market sentiment. As Bitcoin approaches this critical support, the broader financial community is closely monitoring volume metrics and order book depth to determine whether institutional and retail participants will maintain their positions or succumb to a cascading exit strategy.
Chronology of the Current Market Correction
To understand the weight of the $60,000 test, one must look at the preceding months of price action. Following the peak of the recent bullish cycle, Bitcoin entered a phase of consolidation marked by increased volatility. Throughout the second quarter, the asset experienced several attempts to break past its previous resistance levels, only to face heavy selling pressure that pushed prices back into lower ranges.
By mid-June, the market began to show signs of exhaustion. After failing to sustain momentum above the $70,000 mark, the asset underwent a systematic retracement. This descent has been categorized by a series of lower highs, eventually guiding the price toward the current demand zone. The decline was exacerbated by macro-economic headwinds, including shifting expectations regarding central bank interest rate policies and fluctuating demand for spot Bitcoin Exchange Traded Funds (ETFs).
As of late June, the narrative has shifted from growth to defense. The current test of the $60,000 level is the latest in a series of tests that have occurred throughout the calendar year, each serving as a referendum on the strength of the underlying market support.
Technical Foundations and Demand Zones
In technical analysis, a demand zone is defined as a price area where buy orders are concentrated, typically preventing further downside movement. The analysis provided by market participants suggests that $60,000 is not merely an arbitrary round number but a region where historical trading activity suggests a high volume of acquisition.

When an asset enters such a zone, the expectation is that a "defensive reaction" will occur, characterized by an influx of bids that absorb the sell-side pressure. If this zone holds, it serves as a springboard for a recovery. However, the fragility of this support is evident. If the price fails to maintain its footing, the lack of substantial historical buy orders below this level could lead to a rapid acceleration of the decline, often referred to as "slippage" in market terminology.
The target for a successful defense of this zone is currently pegged at $81,000. Reaching this supply area would effectively invalidate the recent bearish sentiment and restore confidence in the upward trend. This move would require a sustained influx of capital, likely from institutional players who have been waiting for a "liquidity grab"—a scenario where stop-loss orders are triggered, clearing the path for a healthier, less leveraged rally.
The Psychological Significance of the $60,000 Threshold
The $60,000 level functions as a psychological barrier that influences the behavior of both retail and algorithmic traders. In professional trading environments, large-scale stop-loss orders are frequently clustered around these major psychological support levels. When the price dips toward these points, the market experiences a phenomenon known as "stop-loss hunting," where the price is pushed below the support level to trigger automated sales.
If the market observes a "decisive close" below $60,000—meaning the daily or weekly candle finishes below this point—it often triggers a shift in sentiment. Traders who were previously optimistic may move to a defensive stance, liquidating positions to preserve capital. This mass exit is what analysts refer to as a breakdown, which can lead to a deeper correction as the market searches for the next credible support level, which some analysts suggest could be significantly lower, potentially in the $50,000 to $55,000 range.
Data-Driven Market Implications
Beyond technical charts, the current Bitcoin market is being influenced by broader financial data. Institutional holdings, as evidenced by the performance of major spot ETFs, have shown a correlation with these price movements. During the recent dip, data suggests that institutional accumulation has slowed, as investors await clearer signals from the Federal Reserve regarding monetary policy.
Furthermore, the "Fear and Greed Index," a common metric used to gauge market sentiment, has hovered in neutral-to-fearful territory during this period of testing. This lack of extreme greed suggests that the market is not currently overextended, which could ironically provide a more stable foundation for a recovery if the $60,000 support holds.
However, the risk remains that a failure to hold this zone will result in a "liquidity cascade." In this scenario, the liquidation of leveraged long positions would force brokers to sell the underlying asset, creating a feedback loop of downward pressure.

The Path to Recovery: Requirements for Bulls
For the bullish case to be validated, Bitcoin must do more than simply avoid a collapse. It must reclaim nearby resistance levels, which act as overhead supply zones. These zones consist of investors who bought at higher prices and are looking to exit their positions at "breakeven" as the price recovers.
A successful reversal requires:
- Defensive Stability: Sustained trading volume above $60,000 that prevents the price from dipping below the floor.
- Resistance Reclamations: The ability to move through minor resistance levels (such as $65,000 and $68,000) with increasing buy-side volume.
- Macroeconomic Support: A stable or favorable economic environment that encourages risk-on asset allocation.
Until these criteria are met, the current market structure remains a binary, high-risk, high-reward proposition. The binary nature of this situation means that there is very little "middle ground" for short-term traders. One is either betting on the resilience of the demand zone or bracing for the volatility of a breakdown.
Industry Perspective and Broader Impact
Market analysts and industry observers generally agree that the current correction is a natural, albeit painful, part of a market cycle. The "halving" event that occurred earlier this year continues to have a lingering effect on the supply-demand equation, effectively tightening the emission of new Bitcoin. While the long-term fundamentals of Bitcoin—namely its capped supply and increasing adoption—remain intact, the short-term price action is dominated by these technical support levels.
For investors, the current period represents a stress test for the asset’s maturity. The transition from a retail-dominated asset to one held by major financial institutions means that Bitcoin is increasingly sensitive to interest rate fluctuations and macroeconomic reports. The outcome of the $60,000 test will likely set the tone for the remainder of the fiscal year.
Should Bitcoin hold the line, it could signal that the "bottom" of the current consolidation phase has been established, providing a reliable platform for the next growth cycle. Conversely, a failure would necessitate a re-evaluation of the market’s trajectory, potentially extending the timeline for a return to all-time highs.
Conclusion
The state of Bitcoin as it approaches $60,000 is a critical reflection of the current financial landscape. Investors and traders are balancing the potential for a robust recovery against the tangible risks of a deeper technical breakdown. As market participants watch the charts for signs of support or capitulation, the $60,000 mark remains the focal point of the global cryptocurrency market. The coming days will be essential in determining whether this level acts as a launchpad for future gains or as a bridge to a more sustained period of market correction. Regardless of the outcome, the event underscores the necessity for vigilance, rigorous risk management, and a comprehensive understanding of the technical factors that govern the digital asset ecosystem.