The cryptocurrency market is currently witnessing a renewed focus on an older Bitcoin roadmap, originally posted in February by crypto commentator Klarck, as Bitcoin’s price movements align remarkably close to one of the key downside zones highlighted months prior. This retrospective examination of a past forecast underscores the enduring influence of technical analysis in volatile markets, even as it presents inherent risks for traders. The roadmap, which initially projected a bounce towards $83,000, followed by a gradual descent into the $65,000–$55,000 region for a two-week accumulation phase, and then an eventual rally to $140,000 per BTC, is now being scrutinized for its predictive accuracy, particularly concerning the imminent downside target.
The Genesis of the Forecast: Klarck’s February Roadmap Unveiled
In February, a period characterized by burgeoning optimism and a burgeoning rally preceding Bitcoin’s halving event, the X user known as Klarck disseminated a detailed Bitcoin price roadmap. At that time, Bitcoin was consolidating after breaking significant resistance levels, and the sentiment was overwhelmingly bullish, anticipating new all-time highs. Klarck’s forecast was notable for its multi-stage prediction: an initial upward trajectory aiming for approximately $83,000, which would represent a substantial gain from February’s levels. This bullish leg was then hypothesized to be followed by a corrective phase, leading to a significant pullback into a defined range of $65,000 to $55,000. Within this range, Klarck anticipated a period of consolidation, dubbed an "accumulation phase," expected to last around two weeks. The culmination of this cycle, according to the roadmap, would be a robust recovery and a subsequent climb to an ambitious target of $140,000 per Bitcoin.
Klarck, operating as an independent crypto commentator rather than an institutional analyst, presented this roadmap as a speculative technical analysis, devoid of the official backing or extensive research resources typically associated with financial institutions. The distinction is crucial; such individual forecasts often gain traction through their perceived accuracy over time, resonating with a community constantly seeking guidance in a market known for its rapid and often unpredictable shifts. The initial reception of the roadmap was likely mixed, as is common with long-term predictions in crypto, with some embracing its bullish long-term outlook and others approaching the predicted downside with skepticism during a prevailing uptrend.
Bitcoin’s Trajectory: Validation Amidst Volatility
Following Klarck’s February publication, Bitcoin embarked on a significant rally, propelled by factors such as the approval of spot Bitcoin Exchange-Traded Funds (ETFs) in the U.S., increasing institutional adoption, and the anticipation of the quadrennial halving event. By mid-March, Bitcoin achieved new all-time highs, surpassing the $73,000 mark. While it did not precisely hit Klarck’s $83,000 target, it came within a reasonable proximity, establishing a strong upward trend that largely validated the initial bullish leg of the forecast. This rally was characterized by significant trading volumes and widespread market enthusiasm, pulling in both retail and institutional investors.
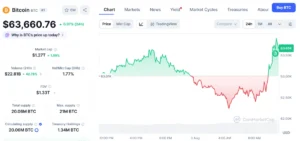
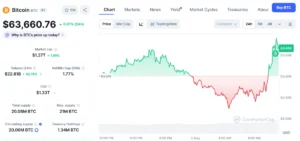
However, as predicted by the roadmap, this upward momentum eventually gave way to a period of correction. Post-halving, Bitcoin experienced increased volatility, driven by a confluence of macroeconomic factors, profit-taking by early investors, and a general recalibration of market expectations. The price began a gradual descent, shedding a significant portion of its gains from the March peak. This corrective phase has now brought Bitcoin’s price into close proximity with the upper boundary of Klarck’s predicted downside range—the $65,000 to $55,000 zone. As of recent market movements, Bitcoin has been testing levels around and just below $60,000, effectively landing within the critical region identified by Klarck months ago.
This alignment of current price action with a specific segment of an older forecast has naturally triggered a resurgence of interest in Klarck’s roadmap. Traders and analysts are revisiting the post, not as a new market signal, but as a compelling example of how historical technical analysis can regain relevance when price begins to confirm its earlier projections. The phenomenon highlights the concept of market memory and the self-fulfilling prophecy often observed in financial markets, where a widely recognized technical level can attract buying or selling pressure simply because it is being watched. The validation of the initial phases of the roadmap lends credibility to its subsequent predictions, albeit with the caveat that past performance is not indicative of future results.
The Critical $65,000–$55,000 Downside Zone: A Battleground for Bulls and Bears
The immediate focus for market participants is squarely on the $65,000–$55,000 zone. From a technical analysis perspective, this range represents a critical support area, a potential inflection point where the market’s current bearish momentum could either stabilize or accelerate. For bulls, holding this zone is paramount; a successful defense could signal the exhaustion of selling pressure and the potential for a reversal. Conversely, a failure to maintain support within this range would embolden bears and could lead to further price depreciation.
If Bitcoin manages to stabilize around the upper end of this zone, specifically near $65,000, it would align with Klarck’s prediction of an impending "accumulation phase." This would necessitate a cessation of lower lows, the establishment of a tighter trading range, and a visible reduction in selling volume. Such a scenario would suggest that investors are finding value at these levels, leading to increased buying interest and a gradual absorption of available supply. On-chain data, such as an increase in Bitcoin being moved off exchanges into cold storage, or a rise in the number of addresses holding a certain amount of BTC, could provide further evidence of accumulation.
However, the risk remains that Bitcoin could fail to hold the $65,000 level. Should this occur, market attention would swiftly shift towards the lower end of Klarck’s predicted range, specifically around $55,000. This level would then become the next significant liquidity target, potentially drawing in stop-loss orders from previous long positions and attracting short-sellers looking to capitalize on further downside. A sustained break below $55,000 would significantly challenge the premise of Klarck’s roadmap, as it would suggest a deeper market correction than initially envisioned for the accumulation phase, potentially pushing Bitcoin into price discovery below crucial psychological and technical support levels.
The confluence of historical price action, Fibonacci retracement levels from previous rallies, and the psychological impact of round numbers often make such predefined zones powerful attractors for price. The $65,000 mark, for instance, has served as both resistance and support in Bitcoin’s past, making its current retesting a pivotal moment for market structure.
The Accumulation Phase: A Crucial Interlude Before the Next Leg
Klarck’s roadmap explicitly mentioned a "two-week accumulation phase" within the $65,000–$55,000 range. In the context of cryptocurrency markets, an accumulation phase is a period where large investors (often referred to as "whales" or institutional entities) gradually buy assets without significantly moving the price, often absorbing sell-side liquidity. This typically manifests as sideways price action, characterized by decreasing volatility and a balance between buying and selling pressure.

For this phase to play out as predicted, several indicators would need to be observed. Firstly, a significant reduction in daily price swings would be expected, forming a relatively narrow trading channel. Secondly, trading volume might initially remain high as sellers capitulate, but then gradually decrease as supply diminishes and buyers become more strategic. On-chain metrics could offer crucial insights: a rise in the number of Bitcoin held by long-term holders, an increase in whale wallet balances, or a net outflow of Bitcoin from exchanges (indicating a preference for self-custody over trading) would all signal an accumulation trend.
The duration specified by Klarck, "two weeks," is relatively short for a substantial accumulation phase, especially one designed to precede a major price surge to $140,000. Historically, accumulation phases that precede significant bull runs can last for several weeks or even months, allowing sufficient time for smart money to position themselves. Therefore, while the occurrence of an accumulation phase would validate another part of the roadmap, its exact duration might be subject to market dynamics and broader macroeconomic influences. Should the accumulation phase extend beyond two weeks, it would not necessarily invalidate the roadmap but would require an adjustment to the projected timeline for the subsequent rally.
The Ultimate Target: $140,000 BTC and Long-Term Projections
Beyond the immediate downside zone and the anticipated accumulation, Klarck’s roadmap ultimately projects a target of $140,000 per Bitcoin. This ambitious figure represents a substantial increase from current levels and would mark a new paradigm for Bitcoin’s valuation. While the near-term focus is on navigating the $65,000–$55,000 range, the long-term target remains a significant aspect of the forecast, influencing the bullish sentiment of those who follow it.
Achieving a $140,000 Bitcoin price would likely require a convergence of several powerful factors. Continued institutional adoption, fueled by the success of spot Bitcoin ETFs, would be a primary driver, bringing in vast pools of traditional finance capital. A favorable macroeconomic environment, characterized by sustained inflation or a weakening U.S. dollar, could further bolster Bitcoin’s appeal as a store of value and a hedge against traditional financial instability. Technological advancements within the Bitcoin network, such as improvements in scalability or security, could also contribute to increased utility and demand. Furthermore, a renewed wave of retail interest, often sparked by media attention around new all-time highs, would be essential to provide the necessary liquidity and momentum for such a surge.
It is crucial to distinguish between the technical analysis of short-to-medium-term price movements and the fundamental drivers required for long-term, exponential growth. While technical patterns can guide traders through cycles, reaching a target like $140,000 often necessitates a fundamental re-evaluation of Bitcoin’s role in the global financial system and widespread adoption that transcends purely speculative interest. The $140,000 projection, therefore, remains highly speculative, dependent not only on the current roadmap playing out but also on a broader set of macro and fundamental catalysts.
Navigating the Perils of Retrospective Forecasts
While the recent alignment of Bitcoin’s price with Klarck’s February roadmap is compelling, it is imperative for traders and investors to exercise extreme caution when relying on old forecasts. The cryptocurrency market is notoriously dynamic, influenced by a myriad of factors that can shift rapidly. Macroeconomic conditions, such as interest rate changes by central banks or global geopolitical events, can quickly alter market sentiment and invalidate even the most meticulously crafted technical analyses. Regulatory developments, liquidity shifts across exchanges, and unforeseen technological advancements or setbacks can also have profound impacts on price trajectories.
One of the significant dangers is confirmation bias, where individuals selectively interpret new information as confirmation of their existing beliefs or a favored forecast. When a part of an old roadmap aligns, it can create a false sense of certainty, leading traders to disregard contradictory signals or to allocate capital based on an incomplete or outdated picture. Markets are adaptive, and what worked in February may not hold true in subsequent months due to evolving market structure and participant behavior.
Therefore, the better approach to utilizing such a forecast is as a reference point rather than a rigid trading plan. It can help frame potential support and resistance levels that the market is currently testing, but it demands continuous validation from real-time price action, volume analysis, and an assessment of prevailing market sentiment. Adaptive technical analysis, which involves constantly updating one’s perspective based on the latest data, is far more prudent than adhering strictly to a prediction made months ago. Sound risk management, including setting stop-losses and managing position sizes, remains paramount, irrespective of how accurate a historical forecast appears to be. The market’s inherent unpredictability necessitates flexibility and a willingness to adjust strategies as new information emerges.
Broader Implications for Market Psychology and Technical Analysis
The resurgence of Klarck’s roadmap highlights several broader implications for market psychology and the practice of technical analysis within the crypto space. Firstly, it underscores the significant role of social media in amplifying and disseminating such forecasts. Platforms like X (formerly Twitter) serve as powerful conduits for sharing analyses, which can quickly gain traction and influence collective sentiment, potentially contributing to the self-fulfilling nature of some predictions.
Secondly, it reignites the ongoing debate about the efficacy and limitations of technical analysis in highly volatile and often irrational markets like cryptocurrency. While some view TA as a reliable tool for identifying patterns and probabilities, others argue that it struggles to account for the unpredictable nature of crypto, where fundamental news or sudden whale movements can override chart patterns. Klarck’s roadmap, in its partial validation, offers ammunition to both sides of this argument – showing its potential utility while simultaneously reminding participants of its inherent speculative nature.
Ultimately, the interplay between on-chain metrics (which provide insight into network activity and investor behavior), fundamental analysis (which assesses the underlying value and potential of an asset), and technical analysis (which studies price and volume patterns) creates a complex tapestry of market understanding. A holistic approach, integrating insights from all these disciplines, is often considered the most robust strategy for navigating the intricacies of the crypto market. The current focus on Klarck’s roadmap serves as a compelling reminder of how past predictions can echo through present market movements, influencing decision-making and shaping narratives, even as the future remains an open question demanding constant re-evaluation.
The ongoing observation of Bitcoin’s performance within the $65,000–$55,000 range will be crucial. Whether it adheres to the predicted accumulation phase and eventually targets $140,000 remains highly speculative. However, the roadmap has undeniably re-entered market conversation, providing a significant reference point for traders navigating the current volatile landscape.