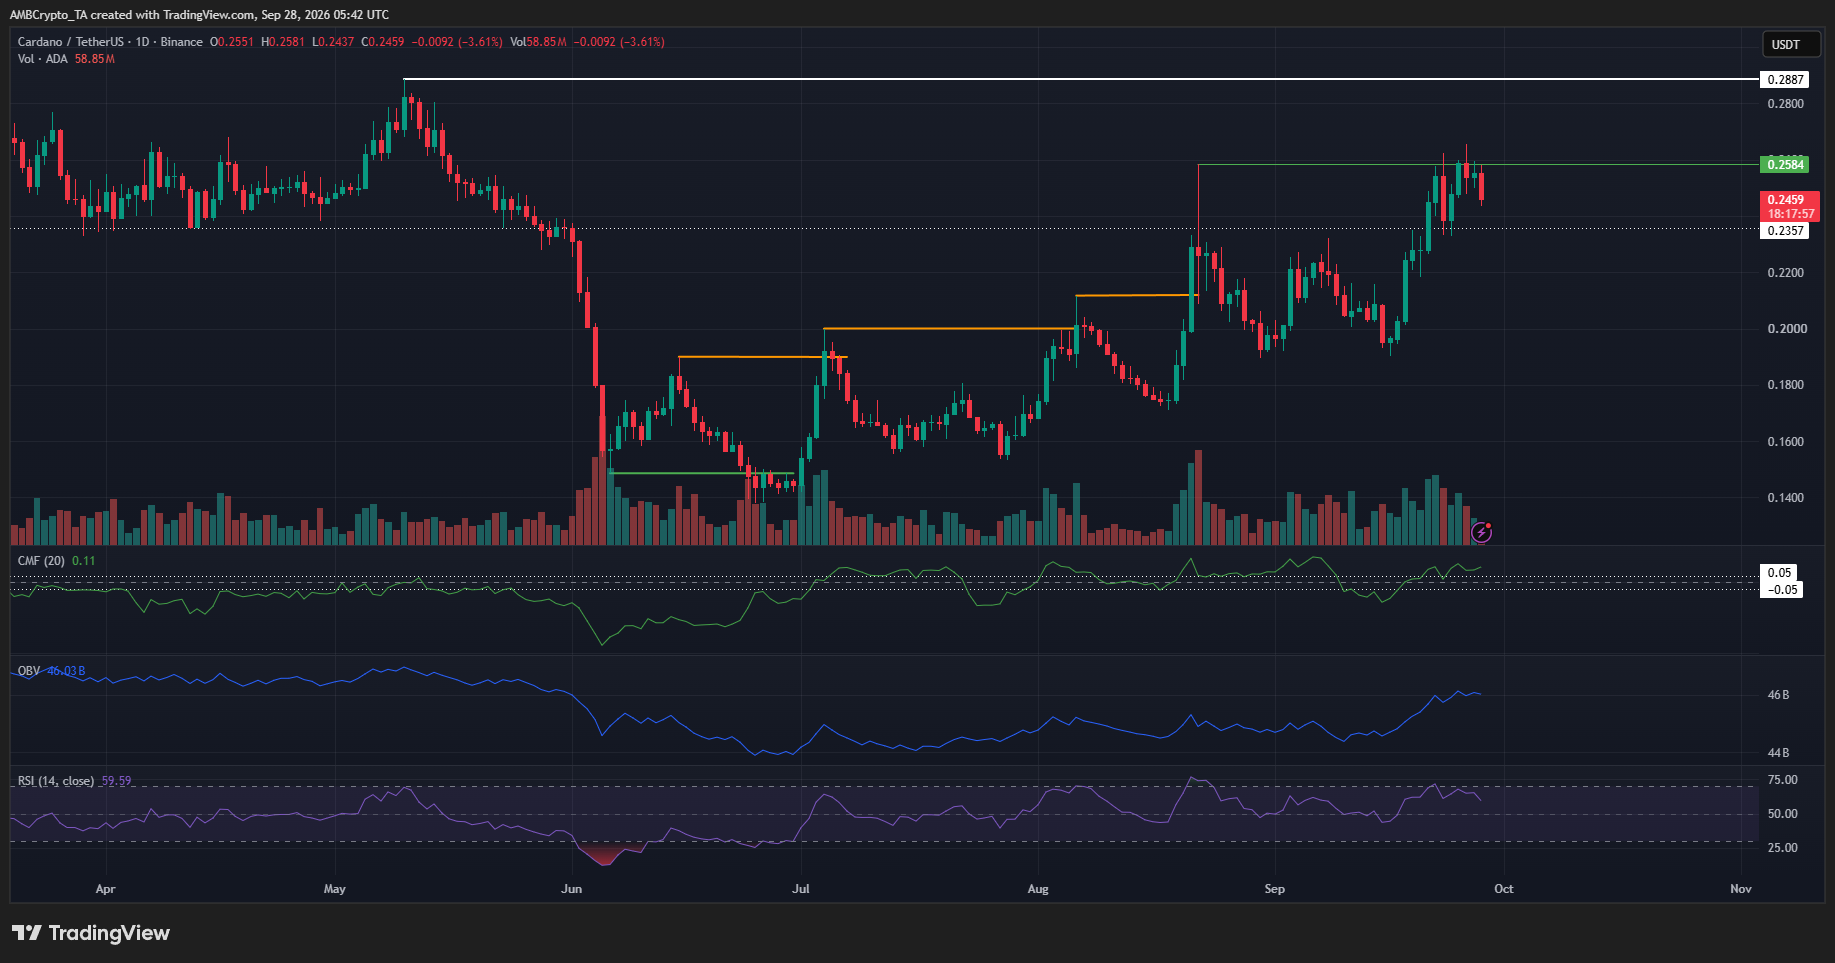
Cardano [ADA] has experienced a notable shift in market momentum, pulling back 2.04% over the past 24 hours while managing to hold onto a respectable 6.89% gain over the trailing week. This recent deceleration in price action materialized near a critical month-old swing high of $0.258, a threshold that has proven to be a formidable barrier for bullish traders. Compounding the downward pressure on the native asset of the Cardano blockchain was a broader macroeconomic and crypto-market correction, highlighted by Bitcoin [BTC] retracing toward the $84,000 price region. As altcoins frequently correlate with the pioneer cryptocurrency’s short-term volatility, ADA’s dip underscored the ongoing sensitivity of the digital asset market to bellwether movements. With the $0.235 support level having been rigorously tested in previous trading sessions, market participants are closely monitoring lower timeframe charts to determine whether Cardano’s correction will deepen or if buyers will step in to defend current valuations.
The broader market context reveals that Cardano’s recent upward trajectory was fundamentally driven by a persistent wave of buying pressure that reemerged over the preceding weeks, allowing the token to reclaim the $0.24 threshold and maintain a macro uptrend. However, as prices advanced, short-term holders who accumulated at lower demand zones faced high levels of unrealized profitability. This dynamic predictably triggered a wave of profit-taking, which effectively stalled the token’s upward momentum even before the broader Bitcoin retracement accelerated the decline. Market analysts note that such behavior is typical during transitional phases of a market cycle, where short-term exhaustion meets macro resistance, creating a tug-of-war between retail momentum traders and longer-term accumulators.
Chronology of the Recent Price Action
The timeline of Cardano’s latest market movements highlights a delicate balance between bullish continuation signals and heavy overhead resistance. On Friday, September 25, Cardano recorded a daily close at $0.2588, marginally eclipsing its previous swing high of $0.2584. While this technical occurrence technically validated a continuation of the bullish market structure on higher timeframes, it simultaneously cemented the $0.260 zone as a robust supply region. Sellers clustered heavily around this psychological barrier, preventing any sustained breakout.
Following this minor high, macroeconomic headwinds and the aforementioned Bitcoin retracement toward the $84,000 mark catalyzed a swift reversal. By the following week, ADA had descended to test the $0.235 support level. This rapid descent caught the attention of derivatives traders and spot market participants alike, as the breach or successful defense of this specific threshold dictates the immediate short-term roadmap for the altcoin. Lower timeframe charts subsequently began flashing cautionary signals, pointing toward a possible extension of the correction phase before any viable reversal pattern can form.

Technical Indicators and Market Data
A comprehensive examination of technical indicators paints a nuanced picture of Cardano’s current market health across multiple timeframes. On the daily chart, underlying metrics continue to display remnants of the previous bullish phase. At the time of reporting, the Chaikin Money Flow (CMF) indicator remained safely above the +0.05 threshold, while the On-Balance Volume (OBV) hovered near multi-month highs. These volume-based indicators confirm that steady, institutional-grade buying pressure has underpinned the market over recent weeks, offering fundamental justification for the broader uptrend despite current pullbacks.
Furthermore, the Relative Strength Index (RSI) on the daily timeframe stood at 59, indicating that buying momentum, while cooling, has not completely collapsed into bearish territory. Nevertheless, the double rejection observed near the $0.26 resistance level has introduced structural vulnerability, increasing the probability of a deeper price retracement.
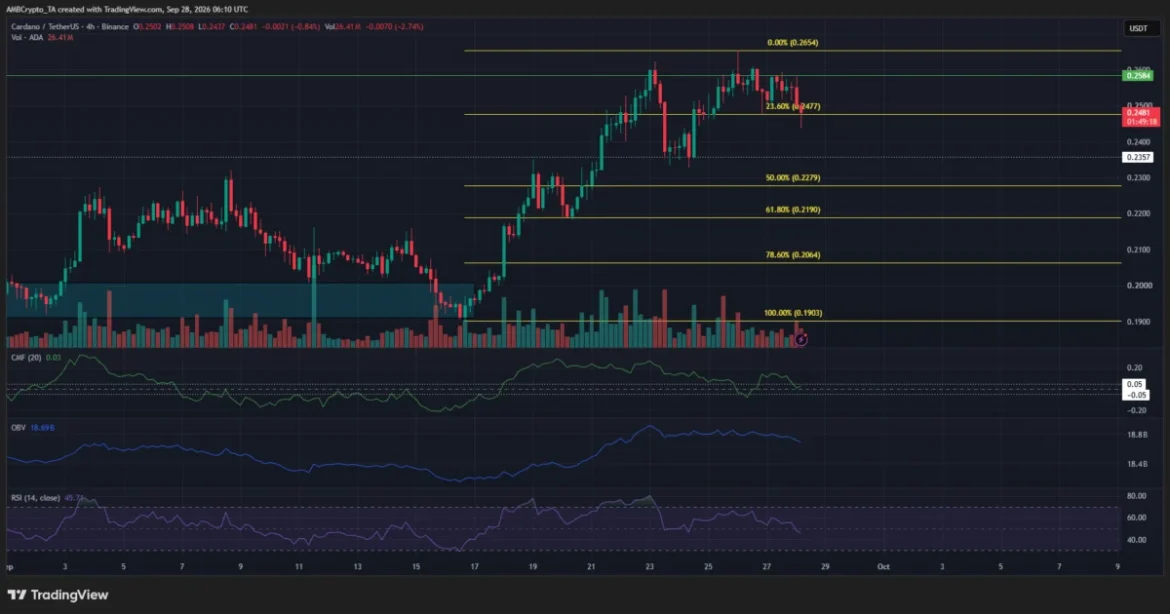
The 4-hour timeframe charts offer a more granular view of the ongoing correction. While the macro structure retains bullish elements, short-term indicators have turned decisively cautious. The 4-hour RSI dipped below the neutral 50 centerline, signaling a temporary shift in momentum toward the bears. Concurrently, the 4-hour CMF retreated into neutral territory, and the OBV began to slope downward, reflecting a temporary exhaustion of active buyers.
Implications of the Fibonacci Golden Pocket
With technical metrics pointing toward sustained downward pressure, market analysts are evaluating historical price action and Fibonacci retracement levels to map out potential downside targets. While the immediate support floor at $0.235 remains critical, technical models suggest that a more profound correction could pull ADA down into the $0.206 to $0.219 price bracket.
This specific range represents the Fibonacci golden pocket, meticulously plotted using the latest impulse move higher from the swing low of $0.190 up to the recent peak of $0.265. In technical analysis, the golden pocket—typically falling between the 61.8% and 65.6% retracement levels—acts as a historically reliable zone for institutional re-accumulation during a healthy bull market pullback. If the $0.235 support fails to absorb the selling pressure, market participants anticipate that ADA will gravitate toward this golden pocket to find a stable structural floor.
Broader Impact and Market Outlook
The unfolding price action in Cardano carries broader implications for the altcoin sector, particularly regarding how mid-cap layer-1 protocols react to Bitcoin’s macro volatility. As Bitcoin consolidates near the $84,000 threshold, altcoin investors are increasingly advised to exercise patience and wait for macro pullbacks to fully materialize before deploying capital. Premature entries during a distribution or retracement phase often expose traders to heightened downside risk, especially when key technical barriers like the $0.26 resistance reject continuation attempts.
For the Cardano ecosystem, the ability to defend foundational support zones like the $0.235 level—or alternatively, to successfully re-test the Fibonacci golden pocket between $0.206 and $0.219—will be paramount in determining the timeline for its next legitimate push toward higher valuations. As on-chain metrics continue to track accumulation patterns and exchange inflows, market stakeholders will remain vigilant, watching for volume confirmation and RSI stabilization before committing to the next directional bias.