Bitcoin is currently navigating a pivotal juncture in its market trajectory, with the $60,000 price point serving as the focal point for both institutional and retail traders. As the premier cryptocurrency experiences heightened volatility, market participants are closely monitoring this psychological and technical threshold to determine whether the asset will maintain its bullish momentum or succumb to a more protracted downward correction. Recent technical analysis from industry observers, including insights shared on TradingView by the analyst known as weslad, highlights this specific price zone as a critical demand area that could dictate the market’s direction for the coming weeks.
The Technical Significance of the $60,000 Threshold
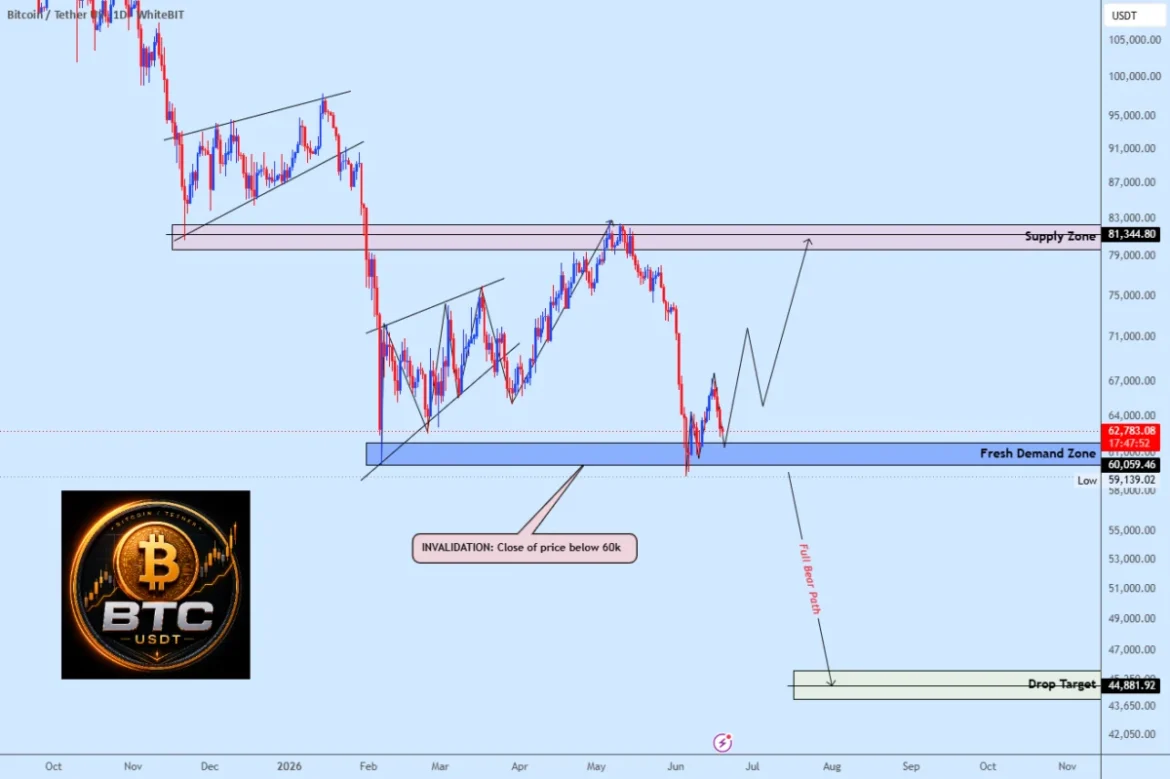
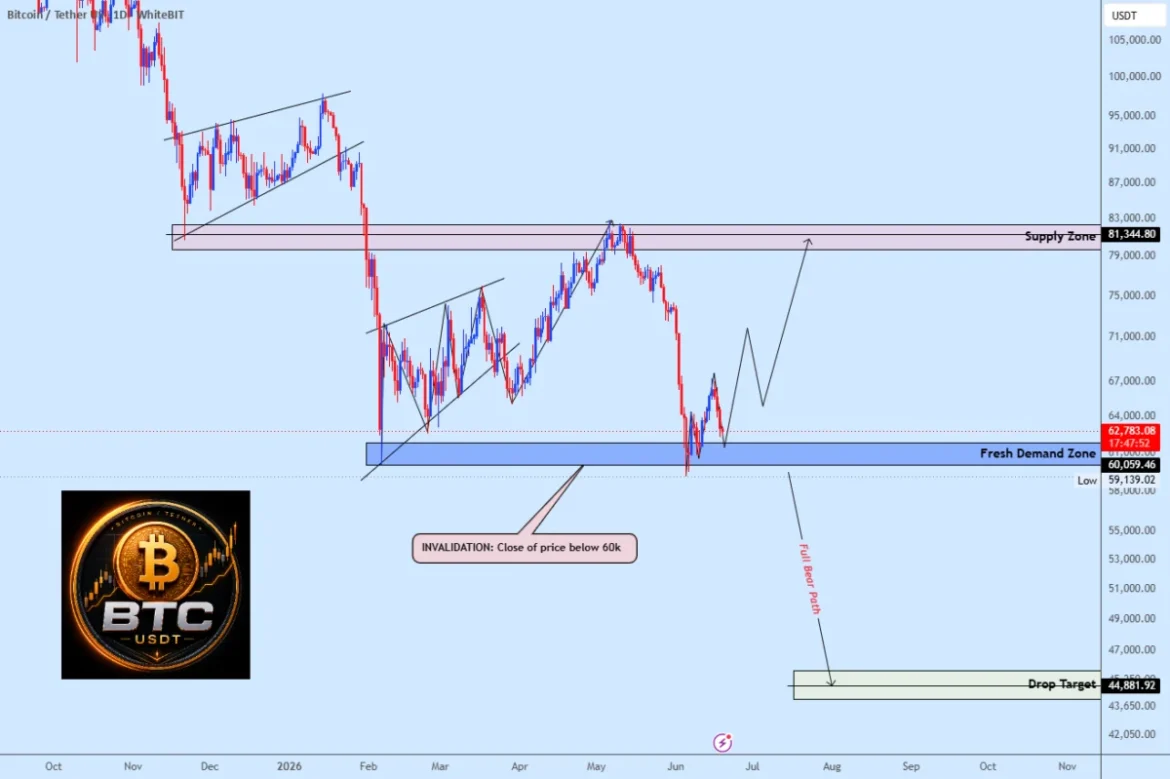
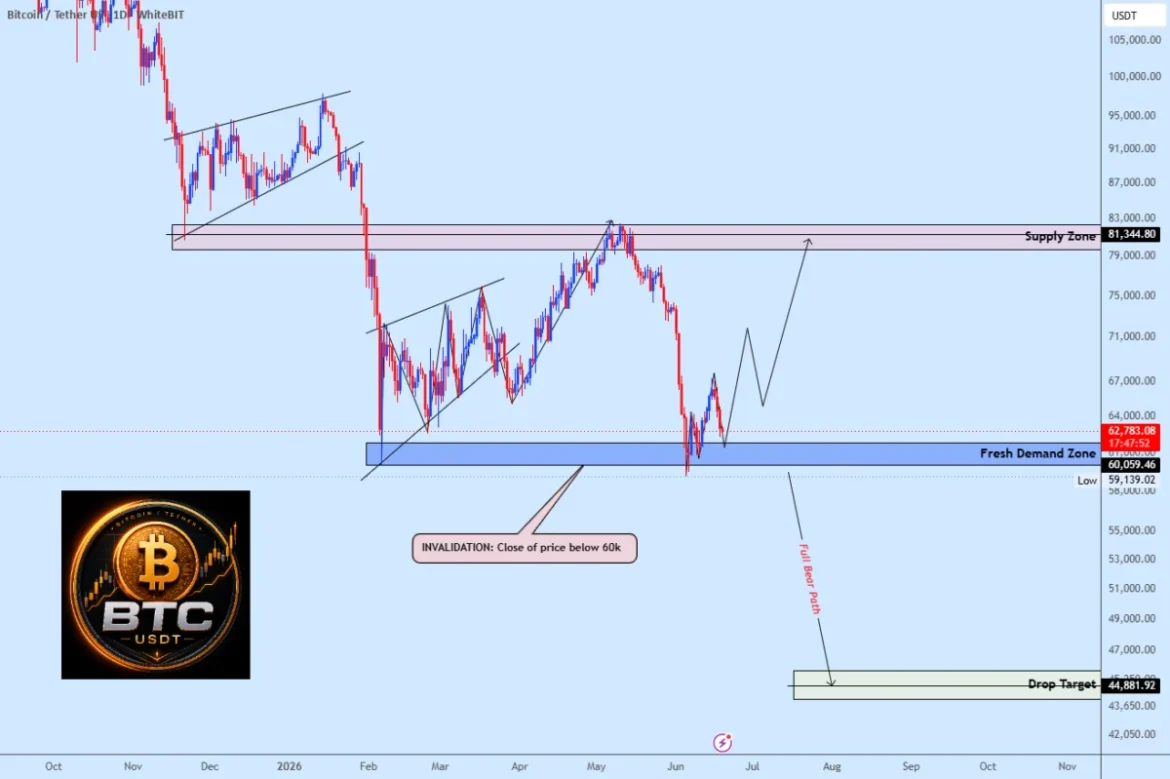
The $60,000 level has evolved into more than just a round number in the current market cycle; it acts as a confluence point for various technical indicators and algorithmic trading triggers. Historically, when Bitcoin approaches such levels, the market typically observes a consolidation of trading volume as buyers attempt to establish a floor. The current analysis suggests that the $60,000 zone functions as a primary demand cluster where previous buying interest has been concentrated.
For market analysts, the durability of this support is paramount. If Bitcoin maintains its position within this demand zone, it effectively validates the thesis that the recent selloff was an exhaustion event rather than a fundamental shift in the asset’s long-term value proposition. Conversely, a failure to hold this support could catalyze a cascade of stop-loss orders. When a widely recognized support level is breached, the liquidity vacuum created by triggered sell orders often exacerbates the downward momentum, potentially pushing the price toward lower support levels that have not been tested in several months.
Chronology of Recent Market Movement
To understand the current state of the market, one must look at the progression of Bitcoin’s price action throughout the second quarter. Following a period of relative stability, Bitcoin began to encounter significant selling pressure, leading to a steady erosion of gains that were consolidated earlier in the year.
- Early Q2 Performance: Bitcoin reached higher valuation levels, driven by optimism regarding inflows into spot exchange-traded funds (ETFs) and anticipation of macroeconomic shifts.
- The Mid-Quarter Correction: As global liquidity conditions tightened and institutional risk appetite waned, Bitcoin began a gradual descent, shedding value as it moved away from its year-to-date peaks.
- The June Test: By late June, the price action intensified as the market retested the $60,000 level. This period has been characterized by high intraday volatility and a struggle between short-term traders looking to capitalize on downward trends and long-term holders aiming to accumulate at perceived discounts.
This chronology demonstrates that the current pressure is not an isolated event but rather the result of a multi-week adjustment in global market sentiment. The transition from a "buy the dip" environment to a "wait and see" approach reflects a cautious stance among major market participants who are awaiting clearer signals from central banks and global economic data releases.

Data-Driven Perspectives on Market Liquidity
Liquidity plays a foundational role in the current price action. In professional trading circles, the $60,000 mark is viewed as a "liquidity pool," a region where significant order flow resides. When the price hovers near this level, the market is essentially testing the depth of the order book. If demand is strong, buyers will absorb the incoming supply, creating a base for a potential rally toward the $81,000 supply zone.
Data from exchange order books indicates that while sell-side pressure has been consistent, there remains a robust cluster of buy orders slightly below the $60,000 threshold. This suggests that while there is fear of a breakdown, there is also a significant cohort of market participants who view the current price as a strategic entry point. The $81,000 target mentioned in the broader market analysis is not an arbitrary figure; it represents a previous supply zone—an area where, historically, sellers have dominated, leading to price declines. Reaching this level would require a sustained influx of capital and a shift in sentiment that currently remains elusive.
The Macroeconomic Environment and Investor Sentiment
Bitcoin does not exist in a vacuum, and its current testing of the $60,000 level is inextricably linked to broader macroeconomic conditions. Investors are weighing the impact of persistent inflation, the trajectory of interest rates, and the geopolitical landscape. In times of uncertainty, capital often rotates out of "risk-on" assets like cryptocurrencies and into traditional hedges.
However, the resilience of Bitcoin in the face of these headwinds provides an interesting case study. Despite the potential for a deeper correction, the underlying blockchain metrics—such as hash rate and wallet address growth—remain steady. This divergence between price action and network health is often cited by proponents as evidence that the long-term bullish outlook remains intact, even if the short-term technicals are challenging.
Implications of a Bullish vs. Bearish Outcome
The binary nature of the current market setup creates two distinct paths forward. A successful defense of the $60,000 support level would likely serve as a confidence builder. If Bitcoin can demonstrate a sharp rejection of lower prices and reclaim nearby resistance levels, it would signal to the market that the demand-side strength is sufficient to overcome the recent selling pressure. Such a recovery could lead to a test of the $81,000 range, effectively neutralizing the recent bearish narrative.
On the other hand, a decisive close below $60,000 would invalidate the immediate bullish thesis. In market parlance, a "decisive close" refers to a candle (daily or weekly) finishing well below the support level, signaling that the breakdown is not merely a "wick" or temporary liquidity grab, but a genuine shift in market equilibrium. Such an outcome would likely force market participants to recalibrate their expectations, with analysts looking toward lower historical support levels to find the next area of stability.

Expert Analysis and Market Psychology
The role of market psychology cannot be overstated. When a technical level like $60,000 is widely discussed across media platforms and trading communities, it becomes a self-fulfilling prophecy. Institutional desks and retail traders alike are watching these levels, which in turn influences their order placement.
Analysts suggest that the current market is in a phase of "bifurcation." On one side are the traders who rely on technical analysis to guide short-term hedging strategies; on the other are the long-term investors who view the $60,000 level as noise in the context of multi-year cycles. This tension creates the high-volume volatility observed recently. The objective reality, however, remains that Bitcoin must "earn" its recovery by proving that the buying interest at $60,000 is sustainable and not merely a temporary reaction to oversold conditions.
Conclusion and Future Outlook
As the market continues to grapple with this critical test, investors are advised to monitor not just the price, but the volume accompanying any movement near the $60,000 level. High volume on a bounce would suggest institutional accumulation, while high volume on a breakdown would indicate a capitulation event.
The path ahead remains complex. While the recovery target of $81,000 offers an enticing goal for bulls, the reality of the current market requires a disciplined approach to risk management. Whether Bitcoin holds this line or tests lower support, the current phase serves as a reminder of the volatility inherent in digital assets and the importance of monitoring technical benchmarks in a globalized, 24/7 market environment. Investors should continue to rely on verified data and objective analysis as the situation evolves, keeping a close eye on both internal network metrics and the broader external economic factors that ultimately drive Bitcoin’s valuation.