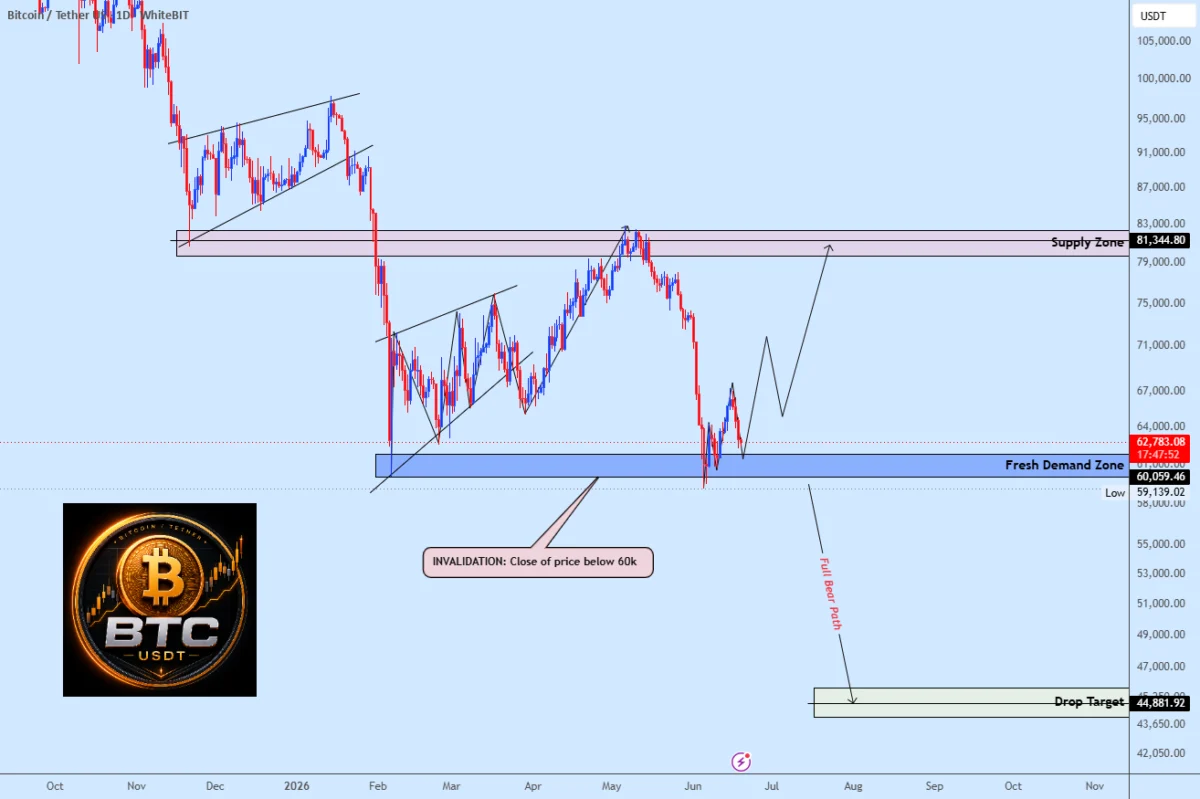
Bitcoin is currently navigating a pivotal juncture as its price action converges on the $60,000 level, a threshold that market analysts characterize as the primary line of defense for the broader bullish outlook. In a technical analysis disseminated via TradingView, market observer weslad identified this specific price point as a high-stakes demand zone. This area, which has seen significant buy-side activity in recent trading sessions, is now being tested for its structural integrity. According to the analysis, the failure to hold this support could trigger a cascade of liquidations, whereas a successful defense provides a technical foundation for a potential recovery toward the $81,000 supply range.
The Technical Significance of the $60,000 Support
In the lexicon of technical analysis, the $60,000 level represents more than just a psychological round number; it functions as a critical liquidity node. When market participants identify a widely watched support level, the concentration of stop-loss orders—both from retail traders and leveraged institutional players—tends to cluster just below that price. Consequently, the market is currently in a state of heightened sensitivity.
If Bitcoin remains above this demand zone, it suggests that institutional buyers are absorbing the selling pressure, effectively exhausting the supply of those looking to exit their positions. Conversely, a decisive break below this level would signal a breakdown in the current market structure. Such a development would likely force a technical pivot, as market sentiment would shift from a "buy-the-dip" mentality to one of risk mitigation, potentially accelerating a deeper correction into the $50,000 to $55,000 range.
Chronology of the Recent Market Contraction
The current test of the $60,000 level follows a period of heightened volatility that began earlier in the second quarter. Throughout the first half of the year, Bitcoin experienced a series of fluctuations driven by macroeconomic data releases, shifting expectations regarding central bank interest rate policies, and fluctuations in spot Bitcoin Exchange Traded Fund (ETF) inflows.
- Early Q2 Peak: Bitcoin reached local highs, bolstered by optimism surrounding the post-halving landscape and sustained institutional interest through regulated financial products.
- Mid-Quarter Consolidation: As inflationary concerns persisted in the United States, Bitcoin entered a period of price compression, struggling to break through previous all-time highs and gradually retreating toward its current support base.
- The June Correction: Increased selling pressure in mid-June intensified the downward trend, leading the asset to re-enter the $60,000 demand zone. This decline was characterized by a cooling of futures market premiums and a decrease in open interest, suggesting that many leveraged traders have already been shaken out of the market.
Supporting Data and Market Dynamics
To understand the weight of the $60,000 test, one must examine the broader market context, including the behavior of the spot Bitcoin ETFs. These vehicles have acted as the primary bridge between traditional finance and the cryptocurrency ecosystem. During periods of price stability, consistent daily inflows into these ETFs have provided a "floor" for Bitcoin’s price. However, in recent weeks, these inflows have turned erratic, with some days recording net outflows.

Furthermore, the "funding rates" in the perpetual futures market provide additional insight. When funding rates are positive and elevated, it indicates that long-position holders are paying a premium to maintain their positions, which is often a precursor to a "long squeeze." As the price has approached $60,000, these funding rates have neutralized, indicating that the market is currently less leveraged than it was during the peak of the rally. While this reduces the risk of an immediate, violent liquidation event, it also suggests that the appetite for aggressive buying has diminished, leaving the market in a precarious state of equilibrium.
The Macroeconomic Environment and Asset Correlation
Bitcoin’s current technical struggle is occurring against a backdrop of shifting macroeconomic conditions. Investors are keeping a close watch on the U.S. Federal Reserve’s stance on interest rates. As a risk-on asset, Bitcoin is inherently sensitive to the cost of capital. Persistent high interest rates generally suppress demand for speculative assets, as investors pivot toward yield-bearing instruments like U.S. Treasury bonds.
Additionally, the correlation between Bitcoin and traditional equity indices, particularly the Nasdaq-100, remains a subject of intense scrutiny. During recent sessions, both the tech-heavy Nasdaq and Bitcoin have shown synchronized movements, suggesting that macro-driven algorithmic trading is playing a larger role than idiosyncratic crypto-native catalysts. If equity markets experience a broader pullback, it is highly probable that Bitcoin will face additional pressure, testing the $60,000 support with even greater force.
Implications of a Potential Recovery
Should the bulls successfully defend the $60,000 level, the technical outlook suggests a clear path for recovery. The $81,000 target identified by analysts is based on the concept of supply-side liquidity. As Bitcoin moves upward, it must contend with "bag holders"—investors who bought at higher prices and are looking for a breakeven point to sell.
A recovery would require a sustained increase in spot market volume. Without a significant catalyst—such as renewed institutional inflows or a dovish pivot from global central banks—a move toward $81,000 would likely be gradual. The market would need to confirm this reversal by reclaiming key moving averages, specifically the 50-day and 200-day simple moving averages (SMA), which currently serve as dynamic resistance levels.
The Risks of a Decisive Breakdown
Conversely, the consequences of a breakdown below $60,000 cannot be overstated. A breach of this support would likely be viewed by technical traders as a "bearish engulfing" event on higher timeframes. When a major support level fails, it often leads to a period of "panic selling," where market participants seek to preserve capital by liquidating positions, regardless of their long-term thesis.

Historical data suggests that such breakdowns often result in a "retest of the origin," meaning that if the $60,000 support was established during a previous rapid leg up, the price could theoretically revisit the lower base levels from where that rally began. This would effectively erase the gains accrued over several months, resetting the market cycle and requiring a longer duration for the asset to build a new base of support.
Institutional and Regulatory Considerations
While the current analysis focuses on technical price levels, it is essential to acknowledge the underlying market structure. The maturation of the Bitcoin market, evidenced by the entry of major asset managers, has introduced a new layer of complexity. Institutional investors often employ systematic, rules-based trading strategies that may be less susceptible to "emotional" panic selling but more sensitive to institutional risk-management protocols.
If institutional risk committees determine that the $60,000 level is a systemic failure point, automated sell orders could be triggered. This institutional participation has provided depth to the market, but it has also increased the correlation between crypto assets and traditional market liquidity. Consequently, the defense of $60,000 is not merely a task for retail traders; it is a test of the conviction held by larger, more sophisticated market participants.
Conclusion: The Binary Nature of the Current Market
The market currently finds itself in a binary state. The $60,000 level serves as the demarcation line between two distinct outcomes. On one side lies the potential for a return to the broader uptrend, supported by the expectation that the recent selloff represents a temporary exhaustion of supply rather than a fundamental change in the market’s trajectory. On the other side lies the risk of a technical breakdown that could reset the market’s pricing expectations for the remainder of the year.
As traders and analysts continue to monitor the price action, the focus remains on the volume profile and the behavior of market participants at this specific threshold. Whether the $60,000 support holds or fails will likely dictate the narrative for the coming quarter, determining whether Bitcoin can regain its upward momentum or whether it must undergo a more rigorous and prolonged period of consolidation. For now, the market remains on high alert, waiting for a definitive signal from the price action to confirm the next directional trend.