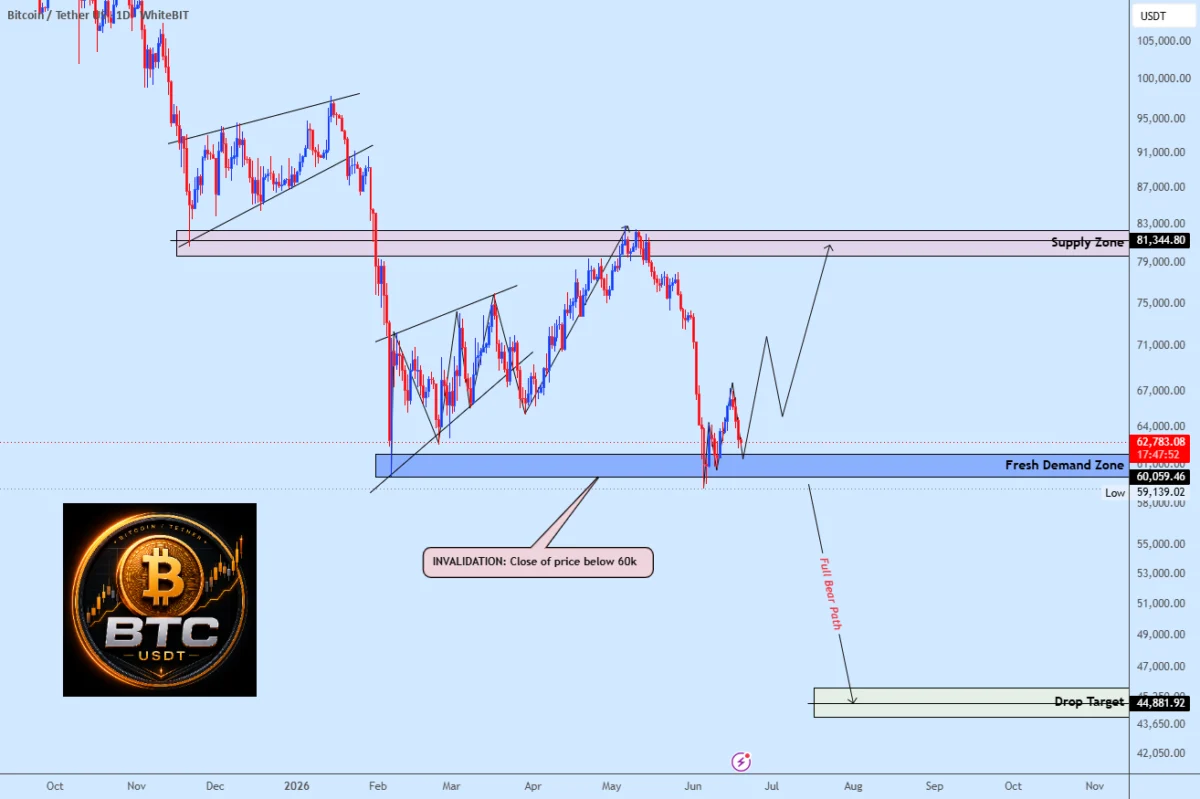
Bitcoin has once again arrived at a pivotal juncture, finding itself testing the $60,000 support level, a price point that serves as both a psychological threshold and a technical anchor for the broader cryptocurrency market. Recent analysis from market observers, including insights provided by the analyst known as weslad on TradingView, underscores the gravity of the current consolidation. As Bitcoin trades within this sensitive demand zone, market participants are closely monitoring whether this area can withstand sell-side pressure or if a breakdown will trigger a more significant shift in momentum.
The significance of the $60,000 level cannot be overstated. Throughout the current fiscal cycle, this price point has acted as a battleground between institutional accumulation and retail-driven liquidity. From a technical perspective, the area serves as a primary demand zone where buyers have historically stepped in to prevent further depreciation. However, the current retest is characterized by heightened volatility, as the market weighs macroeconomic pressures against the inherent scarcity and adoption trends of the digital asset.
The Chronology of Recent Market Movements
To understand why $60,000 has become the focal point of the current market cycle, it is necessary to examine the timeline leading up to this moment. Following the peaks observed in the first quarter of the year, Bitcoin experienced a series of corrections that brought it back to test foundational support levels.
In early June, the market exhibited signs of exhaustion as selling pressure intensified across major exchanges. By the third week of June, Bitcoin began testing the $60,000 support area with increased frequency. This trend was largely attributed to a combination of profit-taking by early-cycle holders and broader risk-off sentiment in global equity markets, which often correlates with fluctuations in the cryptocurrency sector.
Throughout this period, technical indicators, including the Relative Strength Index (RSI) and Moving Average Convergence Divergence (MACD), have signaled a state of equilibrium. The market is currently waiting for a catalyst—either a definitive rebound that would re-establish a bullish trend or a breakdown that would force a revaluation of the asset’s mid-term outlook.
Technical Implications and Market Dynamics
The current market structure suggests that the $60,000 level functions as a "binary" indicator. According to technical analysts, as long as Bitcoin maintains its position within this demand zone, the path of least resistance remains upward, with a potential recovery target set near the $81,000 supply area. This theoretical target represents the point of origin for the recent decline, functioning as a liquidity pool where short positions may be liquidated and long-term momentum could be restored.

However, the analysis also provides a cautionary framework. A decisive close below the $60,000 support would likely invalidate the prevailing bullish thesis. When a widely watched technical level fails to hold, the market often experiences a cascade effect. This phenomenon is driven by the activation of stop-loss orders placed by traders who entered the market during the recent consolidation. A failure to hold this support would not only represent a breach of technical structure but would also signal to institutional investors that the market is currently ill-equipped to absorb the current volume of sell orders.
Macroeconomic Factors Influencing the Digital Asset Landscape
Bitcoin’s current predicament does not exist in a vacuum. It is heavily influenced by the global macroeconomic environment, particularly the policies of central banks regarding interest rates and inflation control. As the Federal Reserve and other major financial institutions maintain their stance on monetary policy, liquidity in risk-on assets fluctuates accordingly.
Historically, Bitcoin has served as a barometer for global liquidity. When market participants perceive that interest rates may remain elevated for longer than anticipated, capital tends to rotate out of speculative assets and into traditional fixed-income securities. This shifting sentiment has contributed to the recent pressure on Bitcoin, as investors look for clarity on the trajectory of the dollar and the stability of global equity markets.
Furthermore, the integration of Bitcoin into the traditional financial system through spot Exchange Traded Funds (ETFs) has changed the nature of support levels. With significant institutional capital now embedded in the market, the $60,000 level is no longer just a target for day traders; it is a critical zone for institutional balance sheets. The defense of this level is, in part, a reflection of the conviction held by these large-scale holders who view any dip toward the $60,000 mark as an opportunity for accumulation rather than a signal for exit.
The Role of Liquidity and Market Sentiment
Liquidity is the lifeblood of any financial market, and the current state of the Bitcoin order books reflects a high degree of caution. Market depth—the ability of the market to handle large orders without significant price impact—has fluctuated as the price approaches the $60,000 threshold.
When market sentiment is polarized, as it is now, order books often exhibit "thinning" on one side, meaning that a relatively small volume of trades can push the price significantly in either direction. This creates an environment where volatility is expected. Investors are currently observing the "depth of the bid," looking for evidence that large buy orders are positioned at or just below the $60,000 mark. If these orders are present and executed, they serve as a foundation for a potential reversal. If they are pulled, it suggests that market makers are anticipating a deeper correction, potentially exposing lower support levels around the $55,000 or $52,000 ranges.
Expert Perspectives and Strategic Considerations
Market analysts and industry experts remain divided on the immediate outlook, though there is a consensus on the importance of the current zone. Many analysts suggest that the recent price action is consistent with a "re-accumulation" phase. In this view, the volatility seen at $60,000 is simply the market shaking out weak hands before a more sustained move to the upside.

From a long-term strategic perspective, the focus remains on the fundamentals of the Bitcoin network. Hash rate, network security, and the ongoing adoption of Layer-2 scaling solutions continue to paint a robust picture for the asset’s long-term viability. These factors provide a floor for the value of the network, even when short-term price action is dictated by speculative sentiment and technical retests.
However, the immediate concern for short-term traders remains the potential for a "liquidity grab." A liquidity grab occurs when the price dips below a major support level, triggering stop-losses and forcing liquidations, only to bounce back sharply. Such events are common in high-volatility assets like Bitcoin and serve to "cleanse" the market of over-leveraged positions. While painful for those on the wrong side of the trade, these events are often viewed by long-term observers as necessary for a healthy, sustainable uptrend.
Broader Implications for the Cryptocurrency Ecosystem
The resolution of the $60,000 test will have implications that extend beyond Bitcoin itself. As the market leader, Bitcoin’s price movements dictate the volatility and trajectory of the broader altcoin market. A successful defense of this level would likely inject confidence into the ecosystem, potentially triggering a relief rally across decentralized finance (DeFi) and layer-1 protocols.
Conversely, a sustained breakdown would likely lead to a period of consolidation or "sideways" trading that could last for several weeks or months. During such periods, the market often experiences a decrease in trading volume and a decline in retail interest, which can make the environment more challenging for new projects and developers.
In conclusion, the market is at a crossroads. The next few sessions of trading will be critical in determining whether the $60,000 level acts as a launchpad for a push toward the $81,000 target or as a failed support that necessitates a deeper, more protracted period of correction. For those closely monitoring the space, the key to navigating this environment lies in identifying whether the volume accompanying the current price action indicates institutional accumulation or a capitulation of sentiment. As it stands, the market remains in a state of high-alert, waiting for the next move in a narrative that continues to define the maturity and resilience of the Bitcoin asset class.