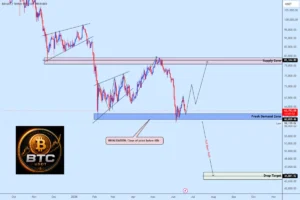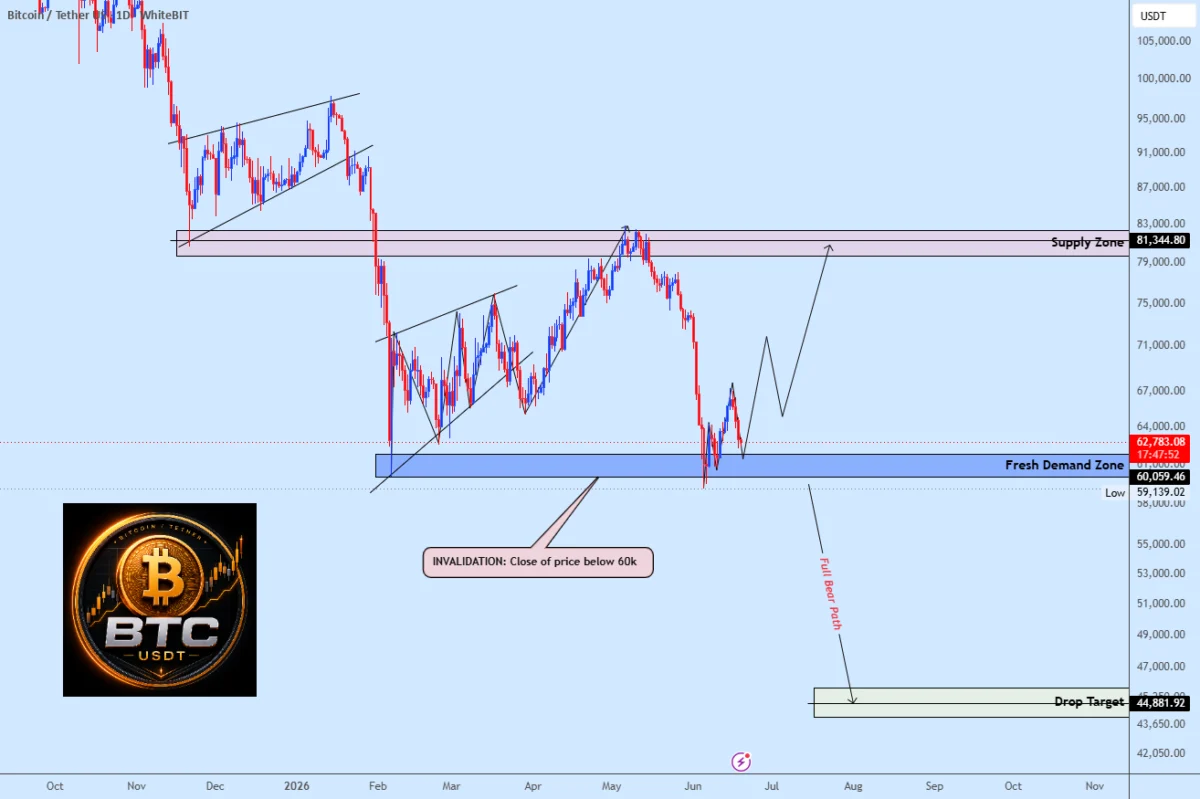
Bitcoin has once again arrived at a pivotal juncture, finding itself testing the psychologically and technically significant $60,000 support level. This price point, which has served as a battleground for market participants throughout the current fiscal cycle, now represents the primary determinant for the asset’s near-term directional bias. Market analysts, including those tracking BTCUSDT movements on platforms such as TradingView, have identified this specific zone as a high-stakes demand area. The prevailing consensus among technical analysts is that this level serves as the last line of defense for the bullish trend that has characterized much of the mid-2025 market environment.
The Significance of the $60,000 Threshold
The $60,000 mark is far more than a simple round number in the context of cryptocurrency trading; it functions as a critical confluence point for institutional and retail liquidity. Historically, this level has acted as a support base that, when successfully defended, paves the way for sustained upward momentum. Conversely, when this support is breached, it frequently serves as a catalyst for cascading liquidations.
In a recent technical assessment, analysts pointed out that the current consolidation around this zone is indicative of exhaustion among sellers. If buyers can maintain their current defensive posture, the technical setup suggests a potential reversal toward the $81,000 supply zone. This move would effectively retrace the most recent decline and return the asset to the origin point of the previous breakout. However, the path to $81,000 is contingent upon the market’s ability to absorb current sell-side pressure without succumbing to a decisive breakdown below the psychological floor.
Chronology of Recent Market Movements
To understand the current state of Bitcoin, one must look at the recent timeline of events that led to this test of support. Throughout the first half of 2025, Bitcoin exhibited a series of aggressive rallies followed by periods of consolidation. The mid-year period saw a significant inflow of capital, largely driven by macroeconomic optimism and the increasing integration of Bitcoin into traditional financial instruments.
By late spring, the market reached a local peak before entering a cooling-off period. During this time, the $60,000 level emerged as a crucial pivot. In June, volatility increased as macroeconomic data points, including central bank interest rate decisions and inflation metrics, began to impact risk-on assets. As the price drifted toward the $60,000 zone, market participants saw a sharp increase in trading volume, suggesting that institutional players were re-evaluating their positions. The current test is the third such instance in the last quarter where Bitcoin has flirted with this specific support level, reinforcing its status as a critical structural component of the current price action.

Supporting Data and Technical Analysis
Technical indicators currently present a binary outlook for the asset. On one hand, the Relative Strength Index (RSI) at the $60,000 support level suggests that the asset is approaching an "oversold" state, which historically correlates with a rebound. On the other hand, the Moving Average Convergence Divergence (MACD) remains in negative territory, indicating that momentum has yet to shift definitively in favor of the bulls.
Furthermore, on-chain data regarding exchange inflows and outflows provides additional context. During the current consolidation phase, there has been a notable decrease in Bitcoin moving onto exchanges, which historically implies that holders are choosing to move their assets into cold storage rather than seeking immediate liquidity. This accumulation behavior is a positive sign for long-term holders, though it does not guarantee immediate short-term price appreciation. The interplay between these on-chain metrics and the technical price floor at $60,000 creates a complex environment where liquidity gaps could lead to rapid price swings in either direction.
The Role of Market Liquidity and Stop-Loss Orders
A primary concern for analysts regarding the $60,000 support is the high density of stop-loss orders positioned just below this level. In market parlance, this is known as a "liquidity pool." When the price dips into such an area, it triggers a chain reaction of automated sell orders. If these orders are triggered simultaneously, the price can experience a "flash" drop, effectively cleaning out the order book before finding a new, lower base.
Therefore, the defense of $60,000 is not merely a matter of buying pressure; it is a defensive strategy intended to prevent the systematic triggering of these stop-loss orders. If the market can maintain a close above $60,000, it sends a signal to institutional participants that the demand is robust enough to overcome short-term fluctuations, thereby discouraging further aggressive short-selling.
Broader Macroeconomic Implications
The volatility in Bitcoin is not occurring in a vacuum. It is deeply intertwined with the broader macroeconomic landscape, specifically the policies of global central banks. As markets grapple with the uncertainty of interest rate paths, investors are constantly recalibrating their risk exposure. Bitcoin, often viewed as a "digital gold" or a hedge against fiat currency debasement, remains sensitive to shifts in bond yields and currency strength.
When yields on traditional government bonds rise, the opportunity cost of holding non-yielding assets like Bitcoin increases. Consequently, the $60,000 test is as much about the prevailing macro sentiment as it is about internal crypto-market dynamics. If macroeconomic conditions remain stable, the technical argument for a recovery toward $81,000 becomes more plausible. If, however, external pressures increase, the $60,000 level may prove to be a fragile support.

Official Reactions and Expert Perspectives
While no single entity governs the price of Bitcoin, industry experts and institutional strategists have consistently emphasized the importance of price stability at this level. Many financial institutions that have recently launched Bitcoin-based products are closely monitoring these volatility cycles. For these entities, a prolonged period of consolidation at or above $60,000 is viewed as a healthy development, as it allows for the stabilization of the asset class after a period of rapid appreciation.
Analysts at leading financial firms have noted that while the current market is "on edge," the underlying fundamentals—such as the increasing scarcity of the asset and the growing adoption of decentralized finance—remain intact. The general consensus among market observers is that a clean breach of $60,000 would force a re-evaluation of long-term portfolios, potentially leading to a period of deeper, more protracted correction before a new bull cycle can commence.
Implications of a Potential Breakout
Should Bitcoin successfully hold the $60,000 support and move toward the $81,000 target, the market implications would be significant. A recovery of this magnitude would likely reignite retail interest and increase trading volume, creating a self-reinforcing cycle of growth. It would also serve to invalidate the bearish narratives that have emerged during the recent price stagnation.
However, a recovery of this scale requires more than just holding the line; it necessitates a sustained breakthrough of interim resistance levels. Specifically, the $70,000 and $75,000 zones would need to be reclaimed as support, transforming them from sell-side pressure points into new foundation layers. Without this sequential reclamation, any move toward $81,000 would be vulnerable to immediate rejection, potentially leading to a "double top" formation that could further complicate the technical outlook.
Conclusion: A Binary Future
The situation at the $60,000 mark is a definitive "wait-and-see" scenario for both institutional and retail traders. The technical setup is clear: the support zone is the threshold between a continued bullish trend and a potential entry into a deeper, more painful correction phase. As the market digests the current price action, the focus remains on whether the bulls can demonstrate the requisite conviction to defend this level.
The coming days will be critical in determining the trajectory for the remainder of the quarter. Market participants are advised to monitor not only the price action at $60,000 but also the accompanying volume, which will indicate the strength of the conviction behind either the buying or selling pressure. In a market characterized by high-frequency trading and rapid information flow, the ability to discern the difference between a temporary dip and a structural breakdown is the hallmark of effective risk management. Until a definitive move is confirmed, the market remains in a state of precarious balance, reflecting the ongoing struggle between those who believe the cycle has more room to run and those who anticipate a period of necessary recalibration.