
The current price action of Bitcoin has moved away from the period of exuberant market sentiment that characterized earlier months of the year, transitioning into what analysts identify as a Dollar-Cost Averaging (DCA) zone. This specific region, observed in previous historical market cycles, often coincides with periods of diminished investor confidence and maximum pessimism. While the current market environment lacks the bullish fervor of past rallies, historical data suggests that this phase may be laying the groundwork for significant long-term growth.
As Bitcoin navigates the $62,000 price range, the market is currently caught between the bearish pressure of institutional outflow signals and the historical precedent of cyclical accumulation. This juxtaposition creates a critical juncture for long-term investors, as the asset mirrors structures seen during the recovery phases of 2019 and 2022.
Historical Context: The Anatomy of Accumulation Cycles
To understand the significance of the current price action, it is necessary to examine the structural similarities between the present market and previous cycles. The "DCA zone" is not merely a technical indicator; it is a psychological threshold where the market narrative often shifts to the idea that Bitcoin is "dead" or structurally broken.
In 2019, following the 2017 peak, Bitcoin experienced a catastrophic decline of approximately 83%, bottoming out near $3,100 before entering a prolonged accumulation phase. This period was marked by intense skepticism, yet it provided the foundation for the subsequent rally that saw the asset reach the $69,000 mark by 2021. The market structure of that era mirrors the current consolidation, where volatility remains present, but the downward pressure has stabilized within a specific channel.

Similarly, the 2022 cycle was defined by the collapse of the FTX exchange in November. This black-swan event triggered a wave of forced liquidations, driving Bitcoin to a low of approximately $15,500. While the duration of the 2022 accumulation phase was shorter than that of 2019, the behavioral pattern remained consistent: intense market fear followed by a disciplined accumulation phase. This accumulation preceded a massive 600% rally, leading to the milestone peak of over $126,000 in October 2025.
Market Dynamics and Technical Indicators
The current monthly timeframe for Bitcoin shows the asset respecting a curved support line that has served as a psychological floor in past cycles. As of the latest market data, Bitcoin is trading at approximately $62,800. For analysts like Ardizor, who have tracked this phenomenon on social media, the technical validity of this support level is the primary determinant of whether the current cycle will follow the trajectories of 2019 and 2022.
However, technical analysis is currently being challenged by on-chain metrics that suggest a more complex environment. For instance, the Realized Cap—a metric that measures the value of all coins at the time they last moved—has seen a contraction of roughly $12 billion since its mid-May peak. This indicates that a significant amount of capital has exited the network or been realized as profit/loss, reflecting a cooling-off period in institutional demand.
Furthermore, the Profit and Loss (PnL) Index, which aggregates various on-chain metrics to gauge the health of the market, suggests that while Bitcoin is in a "transition phase," it has yet to hit a definitive cycle bottom. This creates a divergence between technical price support and fundamental flow data. Despite this, seasoned market participants often argue that these conditions are characteristic of a "bottoming process" rather than a signal of structural failure.
The Role of Institutional Flows and ETF Impact
A primary differentiator in the current market cycle compared to 2019 or 2022 is the presence of spot Bitcoin ETFs. The institutionalization of Bitcoin has fundamentally changed how capital enters and leaves the ecosystem. In previous years, market movements were largely retail-driven, characterized by high volatility and emotional trading. Today, the influence of ETF flows introduces a layer of institutional rebalancing that can exacerbate short-term downward pressure.

When ETFs see sustained outflows, it often creates a "bearish drag" on price, even if the underlying demand from long-term holders (often called "HODLers") remains strong. Current data suggests that while institutional inflows have slowed, there is no evidence of a systemic exodus from the core Bitcoin infrastructure. Instead, the market is experiencing a period of digestion, where the rapid gains of early 2025 are being consolidated at higher levels than in previous years.
Implications for Long-Term Investors
For institutional and retail investors alike, the current phase presents a strategic challenge. The "DCA zone" is effectively defined by a lack of clear direction. Investors who focus on long-term accumulation often ignore short-term volatility in favor of the historical trend that suggests price discovery follows extended periods of consolidation.
The implications of this cycle are twofold:
- Risk Management: The current price level at $62,800 serves as a critical technical support. A breach below this level could force a re-evaluation of the cycle structure, potentially leading to a deeper correction. However, as long as the support holds, the argument for continued accumulation remains the dominant narrative among bullish analysts.
- Capital Efficiency: The decline in the Realized Cap indicates that the market is shedding "weak hands." This process is often a prerequisite for the next leg of a bull market. By clearing out leveraged positions and speculators, the market becomes more resilient to future shocks.
Chronology of the Current Market Cycle
- Q4 2024 – Q1 2025: Rapid appreciation driven by the expectation of increased institutional adoption and macro-economic easing.
- May 2025: The market reaches a local peak, with the Realized Cap hitting record highs, signaling a high level of capital inflow.
- June 2025 – Present: A period of sustained consolidation and moderate decline. The Realized Cap drops by $12 billion, marking a shift toward risk-off sentiment.
- Current Status: Bitcoin oscillates within the DCA zone, testing long-term support levels while market participants monitor for signs of a definitive bottom.
Expert Analysis and Future Outlook
While market analysts are divided on the immediate trajectory, the consensus among those tracking long-term cycles is that the current environment is a test of investor conviction. The historical comparison to 2019 and 2022 suggests that the market is not currently in a state of terminal decline, but rather in a necessary consolidation phase.
The transition from euphoria to apathy is a classic market cycle feature. During periods of euphoria, retail sentiment is at its peak, and prices often become detached from underlying value. Conversely, in the current DCA zone, the focus shifts to the fundamental utility and long-term scarcity of the asset.
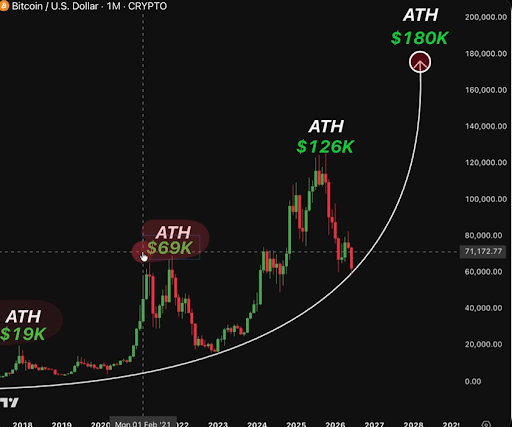
As Bitcoin continues to trade near its support levels, the broader financial community is watching the interaction between ETF liquidity and on-chain accumulation patterns. If the history of the last decade is any guide, the current period of uncertainty is the period during which the most significant gains are typically forged. Investors are advised to monitor the $62,000 support level closely, as it remains the lynchpin for the current cycle’s structural integrity.
Final Considerations
Ultimately, the divergence between bearish on-chain metrics and bullish historical patterns creates a unique environment for the crypto market. The absence of euphoria is arguably a positive signal for long-term health, as it prevents the market from overheating. Whether Bitcoin will replicate its past performance and move toward new highs remains a question of macroeconomic conditions and sustained institutional interest. For now, the "DCA zone" remains the primary area of focus for those looking to position themselves for the next potential phase of the market cycle.