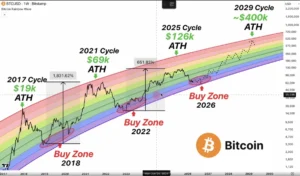
The landscape of the cryptocurrency market has undergone a significant transformation, moving away from the exuberant price discovery phases that characterized much of the previous year. Bitcoin, the world’s leading digital asset, is currently navigating a period defined by cooling sentiment and a return to a familiar technical territory known among institutional investors and seasoned traders as the Dollar-Cost Averaging (DCA) zone. This region has historically served as a foundational base, emerging during periods of widespread market apathy and preceding substantial bull runs in past cycles.
As Bitcoin trades near the $62,800 mark, analysts are increasingly drawing parallels between the current market structure and the depressive phases observed in 2019 and 2022. While the current environment is marked by macroeconomic uncertainty and fluctuations in institutional inflows, the structural setup suggests that a period of strategic accumulation may be underway.
A Historical Analysis of Market Cycles
To understand the significance of the current price action, one must look at the historical trajectory of Bitcoin’s market cycles. In 2019, following the significant correction from the 2017 highs of $19,000, Bitcoin experienced a protracted period of stagnation. During this time, the asset shed more than 83% of its value, leading to a climate of extreme pessimism where market participants largely abandoned the space. However, this period of "capitulation" created a long-term accumulation zone that served as the springboard for the 2021 bull market, which saw Bitcoin reach a then-record high of $69,000.

A similar, albeit more compressed, phenomenon occurred in 2022. The collapse of the FTX exchange in November of that year acted as a catalyst for a massive wave of forced liquidations, driving the price of Bitcoin down to approximately $15,500. Despite the prevailing fear and the declaration by many mainstream outlets that Bitcoin was "dead," the asset began a steady recovery. This recovery was not immediate but was defined by disciplined buying within a specific price band, eventually leading to a 600% rally that propelled Bitcoin past $100,000 and culminated in a new record high of over $126,000 by October 2025.
Current chart analysis from market observers, such as the analyst known as Ardizor, highlights that the monthly candlestick structure has returned to a curved support level that mirrors these past two cycles. The implication is that while the short-term price movement may appear stagnant or bearish, the long-term structural integrity remains intact, suggesting that the current volatility is a standard feature of market maturation rather than a systemic failure.
The Dynamics of Current Market Pressure
While the technical setup favors a bullish long-term outlook, the immediate environment is complicated by several bearish headwinds. One of the primary factors is the behavior of institutional capital, particularly regarding Bitcoin Exchange-Traded Funds (ETFs). Recent data indicates a shift in the momentum of inflows, with some institutional entities opting to pause or divest, contributing to downward pressure on the spot price.
Furthermore, on-chain metrics provide a sobering look at the current liquidity situation. The "Realized Cap"—a metric that values each coin at the time it last moved, effectively tracking the aggregate cost basis of all investors—has seen a contraction of approximately $12 billion since its mid-May peak. This reduction suggests that long-term holders are either exiting positions or that the market is witnessing a churn of capital, where older, "smart money" is shifting hands.

The Bitcoin Profit and Loss (PnL) Index, which synthesizes various on-chain indicators, currently signals that the market is in a "transition phase." While it has not yet reached the extreme oversold conditions that typically mark an absolute cycle bottom, it has moved away from the overheating indicators seen at the start of the year. This transition phase is often the most difficult for investors to navigate, as it is characterized by "sideways" price action that tests the conviction of those who entered the market during the previous rally.
Macroeconomic Implications and Institutional Outlook
The broader impact of this consolidation period extends beyond the crypto-native ecosystem. As Bitcoin becomes increasingly correlated with traditional risk assets, its price action is heavily influenced by the monetary policy decisions of major central banks, particularly the U.S. Federal Reserve. Higher-for-longer interest rate environments traditionally create a liquidity crunch, which tends to impact speculative assets like Bitcoin before flowing through to broader markets.
However, many institutional analysts argue that the current "discount" provided by the DCA zone is an anomaly created by short-term macroeconomic fear. The narrative among major institutional players, including representatives from firms like Coinbase, remains focused on the long-term scarcity of Bitcoin. The argument is that governments and large-scale financial institutions are viewing the current price levels as an opportunity to bolster their digital asset reserves. By treating the current price levels as a "discounted" entry point, these entities are effectively providing a floor for the asset, preventing a more catastrophic drawdown.
The Role of Retail and Institutional Sentiment
The current market sentiment, often quantified by the Fear & Greed Index, has fluctuated significantly. When the market is in a state of high fear, it traditionally correlates with the "accumulation zone" identified by analysts. The irony of the crypto market is that the periods of maximum silence and disinterest from the retail sector are often the periods where the most significant long-term wealth is built.
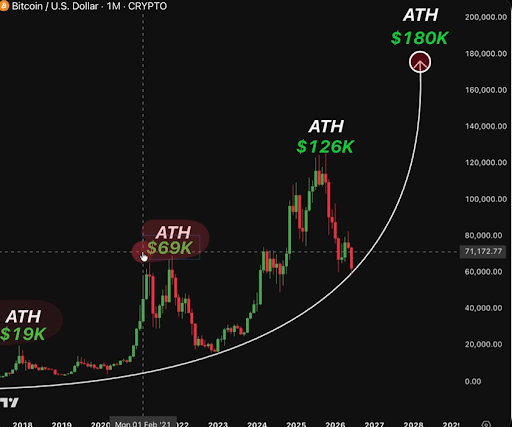
The transition from a speculative, euphoria-driven market to one of disciplined, long-term accumulation is a hallmark of a maturing asset class. While the current price of $62,800 is a far cry from the $126,000 highs of late 2025, the underlying fundamentals of the network—such as hashrate, active addresses, and institutional adoption—have remained robust. The discrepancy between price and network value is what leads many analysts to conclude that the current "DCA zone" is not a sign of terminal decline, but rather a necessary recalibration.
Future Projections and Expert Consensus
Moving forward, the primary metric for investors to watch is the stability of the long-term support levels on the monthly timeframe. Should Bitcoin maintain its position within the identified accumulation band, it would further validate the comparison to the 2019 and 2022 recovery cycles. Conversely, a failure to hold this structure could lead to a deeper testing of lower support levels, potentially shaking out weaker hands and resetting the cost basis of the entire market.
Most experts suggest that the "bottoming" process is rarely a singular event but rather a series of developments that unfold over several months. The current transition phase is expected to persist until there is a clearer signal from global liquidity conditions or a major shift in the regulatory landscape. Until that time, the market remains in a state of wait-and-see, where the primary risk is not the volatility of the asset itself, but the lack of conviction among participants who are prone to selling into the fear that characterizes the base of a cycle.
In conclusion, the current state of the Bitcoin market, while testing the patience of investors, conforms to a well-documented pattern of behavior that has preceded significant growth in the past. By moving into a zone where fear dominates the narrative, the market is effectively purging excess leverage and resetting expectations. For those with a long-term horizon, the current environment presents a window of opportunity to accumulate at levels that history suggests will be viewed as significant discounts in the years to come. Whether this cycle follows the exact script of 2019 and 2022 remains to be seen, but the structural parallels provide a compelling case for those looking at the broader, multi-year trajectory of the digital asset economy.