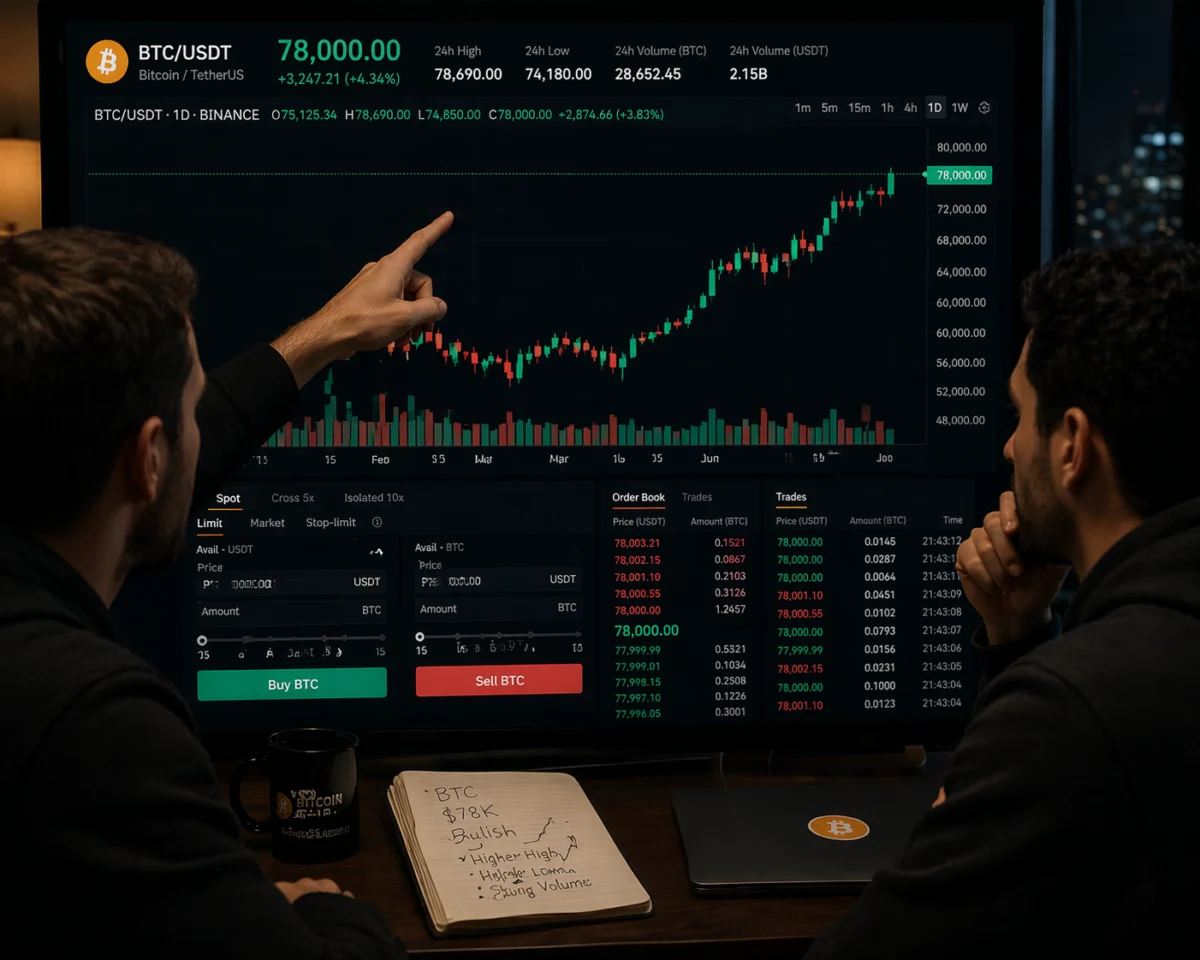
Bitcoin (BTC) extended its robust upward trajectory on Wednesday, climbing above the $78,000 threshold following a dynamic 6% rally over the course of the week. This price action, which saw the world’s leading cryptocurrency hit a multi-month high of $78,452, comes amid a complex backdrop of shifting geopolitical alliances and significant maneuvers by the United States Treasury. While institutional demand via spot Bitcoin Exchange-Traded Funds (ETFs) showed a marked deceleration on Tuesday, the broader market sentiment remains anchored by expectations of increased global liquidity and a temporary de-escalation of tensions in the Middle East.
The digital asset’s ascent to its highest valuation since early February reflects a growing appetite for risk-on assets. This surge is particularly notable given the cooling of ETF inflows, which dropped to a modest $11.84 million on Tuesday—a sharp decline from the $238.37 million recorded just twenty-four hours prior. Market analysts suggest that while institutional investors have adopted a "wait-and-see" approach regarding ongoing diplomatic negotiations, the underlying technical structure and macroeconomic tailwinds continue to favor the bulls.
Geopolitical De-escalation and the Trump Administration’s Diplomatic Efforts
The primary catalyst for the mid-week rally appears to be the extension of a critical two-week ceasefire involving regional powers in the Middle East. Late Tuesday, U.S. President Donald Trump announced that the ceasefire, originally slated to expire on April 22, 2026, would be extended. This decision followed a formal request from the Pakistani government, which has been acting as a diplomatic intermediary. The extension is intended to provide a window for Washington to receive and review a unified diplomatic proposal from Tehran.
While President Trump maintained a firm stance, emphasizing that the U.S. naval blockade of Iranian seaports would remain strictly enforced, the mere avoidance of immediate escalation triggered a relief rally across global markets. For Bitcoin, which has increasingly functioned as a barometer for geopolitical risk and global liquidity, the news provided the necessary momentum to break through previous resistance levels.
The ceasefire extension has reduced the "war premium" often priced into commodities like oil, while simultaneously boosting confidence in risk assets. Investors are viewing the diplomatic window as a sign that a broader regional conflict may be averted, or at least delayed, allowing for a more stable trading environment. The involvement of Pakistan as a mediator adds a layer of complexity to the situation, suggesting a multi-polar effort to stabilize one of the world’s most volatile regions.
The US Treasury’s $15 Billion Buyback: A Liquidity Injection
Parallel to the geopolitical developments, the U.S. Treasury’s fiscal policy is playing a pivotal role in supporting Bitcoin’s price action. The Treasury is poised to initiate a buyback of $15 billion of its own debt this week, a move that matches the largest buyback in the nation’s history. This operation is designed to improve the liquidity of the government securities market by purchasing older, less liquid "off-the-run" bonds and replacing them with more current "on-the-run" debt.
For the cryptocurrency market, the implications of such a massive buyback are profoundly bullish. When the Treasury buys back debt, it effectively injects cash into the financial system, increasing the overall supply of liquidity. As a liquidity-driven asset, Bitcoin historically thrives in environments where excess capital is seeking higher returns. The $15 billion injection is expected to ease conditions in the repo markets and lower the cost of capital, providing a favorable tailwind for speculative and growth-oriented investments.
Economists note that these buybacks are often seen as a form of "stealth" stimulus. While not a direct change in interest rate policy by the Federal Reserve, the net effect is a more fluid financial environment. For Bitcoin, which is often dubbed "digital gold," the influx of fiat liquidity serves as a reminder of the asset’s fixed-supply appeal in an era of expanding government balance sheets.
Institutional Pulse: Analyzing the Spot ETF Inflow Slowdown
Despite the price appreciation, the institutional appetite for Bitcoin spot ETFs showed signs of hesitation on Tuesday. The recorded inflow of $11.84 million represents a significant retracement from the high-conviction buying seen earlier in the week. This deceleration suggests that while retail and momentum traders are driving the current breakout, institutional desks may be hedging against the uncertainty of the US-Iran peace talks.

The disparity between price growth and ETF inflows highlights a potential divergence in market participation. Large-scale institutional allocators, including those managing portfolios through BlackRock, Fidelity, and Grayscale, often prioritize stability and clear policy directions. The current "holding pattern" in ETF demand likely reflects a cautious interpretation of the geopolitical situation. Should the ceasefire lead to a more permanent diplomatic resolution, analysts expect a surge in institutional "catch-up" buying, which could propel Bitcoin toward the psychological $80,000 mark.
Technical Analysis: Bullish Indicators and Key Levels to Watch
From a technical perspective, the BTC/USD 4-hour chart paints a decidedly bullish picture. Bitcoin is currently trading comfortably above its 50-day and 100-day Exponential Moving Averages (EMAs), which sit at $72,345 and $75,368, respectively. The fact that the price remains well above these key indicators suggests that the medium-term trend is firmly upward.
The Relative Strength Index (RSI), a momentum oscillator that measures the speed and change of price movements, remains in constructive territory. While it is approaching overbought levels, it has not yet signaled a reversal, indicating that there is still room for upward expansion. Similarly, the Moving Average Convergence Divergence (MACD) histogram remains in the green, confirming that buyers are maintaining control of the narrative.
Looking ahead, the market faces several critical hurdles:
- 50% Fibonacci Retracement ($78,962): This level represents a major technical resistance point. A clean break above this could trigger a wave of FOMO (fear of missing out) among sidelined investors.
- The $80,000 Psychological Barrier: Beyond technical levels, $80,000 represents a massive psychological milestone for the market.
- 200-day EMA ($82,769): This serves as the ultimate target for the current bullish cycle.
Conversely, should a correction occur, several layers of support are in place to cushion the fall. Initial support is expected at the prior channel top of $75,680. Deeper protection is provided by the 100-day EMA at $75,368 and the 38.2% Fibonacci level at $74,487. A worst-case scenario would see Bitcoin testing the lower channel boundary near $62,950, though such a move would likely require a significant breakdown in the current geopolitical ceasefire.
Chronology of the Recent Surge
To understand the significance of the current price level, it is essential to look at the timeline of events leading up to the April 22 peak:
- February 3, 2026: Bitcoin hits a local peak before entering a period of consolidation and volatility amid rising Middle Eastern tensions.
- April 15, 2026: The initial ceasefire is brokered, providing a floor for Bitcoin at the $68,000 level.
- April 20, 2026: Bitcoin surges 6% in anticipation of the U.S. Treasury buyback announcement, breaking the $75,000 resistance.
- April 21, 2026: Spot ETFs record $238 million in inflows as institutional confidence briefly peaks.
- Late April 21, 2026: President Trump announces the ceasefire extension, pushing BTC to its current high of $78,452.
- April 22, 2026: The market stabilizes above $78,000 as investors digest the implications of the Treasury’s $15 billion liquidity injection.
Broader Market Implications and Future Outlook
The current rally in Bitcoin is not happening in a vacuum. The broader cryptocurrency market has also seen significant gains, with Ethereum and various high-cap altcoins following Bitcoin’s lead. This "rising tide" effect suggests that the market is transitioning into a new phase of the bull cycle, driven by a combination of macroeconomic stability and fiscal expansion.
However, the road ahead is not without risks. The ongoing naval blockade of Iran remains a significant "black swan" variable. Any skirmish or violation of the ceasefire could lead to a rapid "risk-off" event, causing Bitcoin to shed its recent gains as investors flock back to the U.S. Dollar or physical gold.
Furthermore, the U.S. Treasury’s buyback program, while beneficial for liquidity, raises long-term questions about debt sustainability and inflationary pressures. If the market begins to price in higher long-term inflation as a result of these liquidity injections, Bitcoin’s role as an inflation hedge will be put to the test.
For now, the consensus among market participants is one of cautious optimism. The combination of a diplomatic reprieve in the Middle East and a massive injection of liquidity from the U.S. Treasury has created a "Goldilocks" scenario for Bitcoin. As the market eyes the $80,000 milestone, the focus will remain on the progress of the peace talks in Washington and the successful execution of the Treasury’s debt buyback program. If these factors continue to align, the $78,000 mark may soon be viewed not as a peak, but as a new floor for the world’s premier digital asset.