
The intersection of decentralized finance protocol upgrades and macroeconomic market trends often yields a complex narrative, and the Layer 1 EVM-compatible blockchain Flare (FLR) serves as a prime case study. Earlier this year in April, the Flare community overwhelmingly approved Flare Improvement Proposal 16 (FIP 16), with an impressive 98.06% of participating voters casting ballots in favor. This sweeping governance decision was designed to fundamentally restructure FLR’s token issuance model, optimize burn rates, recalibrate transaction fees, and redefine protocol revenue streams.
Months after the implementation of FIP 16, a comprehensive data report from DeFiLlama has brought the tangible onchain effects of these structural changes into sharp focus. While network security and protocol economics have demonstrated remarkable organic improvements, the native asset, FLR, continues to grapple with a persistent, long-term bearish price trend on both daily and weekly charts. This divergence between strengthening foundational metrics and subdued market valuation highlights the intricate challenges facing Layer 1 tokens in a mature crypto cycle.
Understanding the Genesis: Flare Improvement Proposal 16 (FIP 16)
To fully comprehend the current state of the Flare Network, one must examine the baseline economic conditions that preceded FIP 16. Historically, many foundational Layer 1 blockchain architectures struggle with high initial token inflation rates required to bootstrap network security, incentivize validators, and fund ecosystem development. However, excessive inflation frequently creates persistent downward pressure on token prices, frustrating retail and institutional holders alike.
Recognizing these structural headwinds, the core development team and community stakeholders introduced FIP 16 in the early months of the year. The proposal aimed to transition Flare toward a more sustainable, activity-linked economic model. By addressing the core pillars of tokenomics—issuance, utility, and deflationary burn mechanisms—the proposal sought to align the long-term interests of token holders with the actual operational usage of the network.
When the voting concluded in April, the near-unanimous approval signaled a united community front eager to transition away from inflationary subsidies and toward a value-accruing protocol design. The roadmap laid out by FIP 16 was aggressive, requiring multi-phase technical updates, code audits, and core protocol modifications, culminating in critical network upgrades executed throughout the summer.
Chronology of Network Transformation: From Spring Policy to Summer Execution
The rollout of FIP 16’s directives transformed Flare Network’s operational landscape through a carefully timed sequence of protocol upgrades and supply adjustments:

- April: Flare Improvement Proposal 16 is officially passed by the community, securing a 98.06% approval rate. The vote mandates a comprehensive overhaul of token issuance schedules, burn mechanics, and fee distribution frameworks.
- May: The immediate effects of the governance vote materialize onchain. Flare’s monthly token issuance rate drops significantly from 5% down to 3%, successfully curbing the influx of newly minted tokens into the broader ecosystem.
- July 14: Core developers implement a major network hard fork designed to optimize protocol efficiency and supercharge the asset’s deflationary mechanisms. Following this upgrade, transaction-based token burns surge dramatically.
- July – August: Staking metrics experience a massive upswing. Total FLR locked in staking contracts climbs from 16 billion tokens in July to 21 billion tokens by late August, reflecting growing validator participation and long-term investor commitment.
- Late August: The proportion of staked-or-delegated FLR relative to circulating supplies reaches 46%, a substantial leap from the 32% recorded just weeks prior in July. This metric underscores a successful effort to remove liquid tokens from immediate circulation.
Quantifying the Onchain Impact: Supply Dynamics and Burn Rates
The empirical data compiled by DeFiLlama illustrates a profound shift in Flare’s supply-side dynamics. By reducing token issuance from 5% to 3% in May, the network effectively decelerated the rate of supply expansion. In tandem with this reduction in inflation, the ecosystem experienced a dramatic acceleration in its deflationary capabilities.
Following the critical hard fork on July 14, Flare’s token burn rate increased by at least tenfold compared to preceding months. In blockchain network architecture, a burn mechanism permanently removes tokens from circulation by sending them to unspendable addresses, typically utilizing a portion of transaction fees or protocol revenues. When combined with a lower inflation rate, an exponentially higher burn rate creates a powerful net-deflationary pressure vector.
Furthermore, the behavior of token holders shifted dramatically over the summer. Network participants increasingly chose to secure the Flare ecosystem rather than hold liquid tokens on centralized or decentralized exchanges. Total staked tokens rose from 16 billion in July to 21 billion by the end of August. More importantly, the proportion of staked-or-delegated FLR climbed from 32% to 46% during the same timeframe. This massive withdrawal of supply from the immediate market created a tighter float, theoretically reducing immediate sell-side liquidity and reinforcing network security through broader decentralization.
Divergence in the Markets: Technical Analysis of FLR Price Action
Despite the objectively bullish implications of lower inflation, a tenfold increase in the burn rate, and nearly half of the active supply being staked or delegated, the market valuation of FLR has told a starkly different story. Technical analysis of the FLR price charts reveals a prolonged downward trajectory that has tested the patience of market participants.
The weekly chart for the FLR/USDT trading pair outlines a clear, persistent bearish trend. The broader market structure turned decisively bearish in December 2025 when FLR slipped below the critical swing low of $0.0121. Since that time, upside momentum has been entirely absent. Technical momentum indicators confirm this sustained weakness; the Relative Strength Index (RSI) has remained entrenched below the neutral 50 threshold since October 2025, signaling persistent bearish control without meaningful oversold relief rallies that could trigger a reversal.
Concurrently, the On-Balance-Volume (OBV) indicator has traced a persistent downtrend. OBV tracks cumulative buying and pressure by adding volume on up days and subtracting it on down days; the continuous downward slope of Flare’s OBV confirms that capital has been steadily exiting the asset rather than accumulating during price dips.
Analyzing Key Support and Resistance Levels
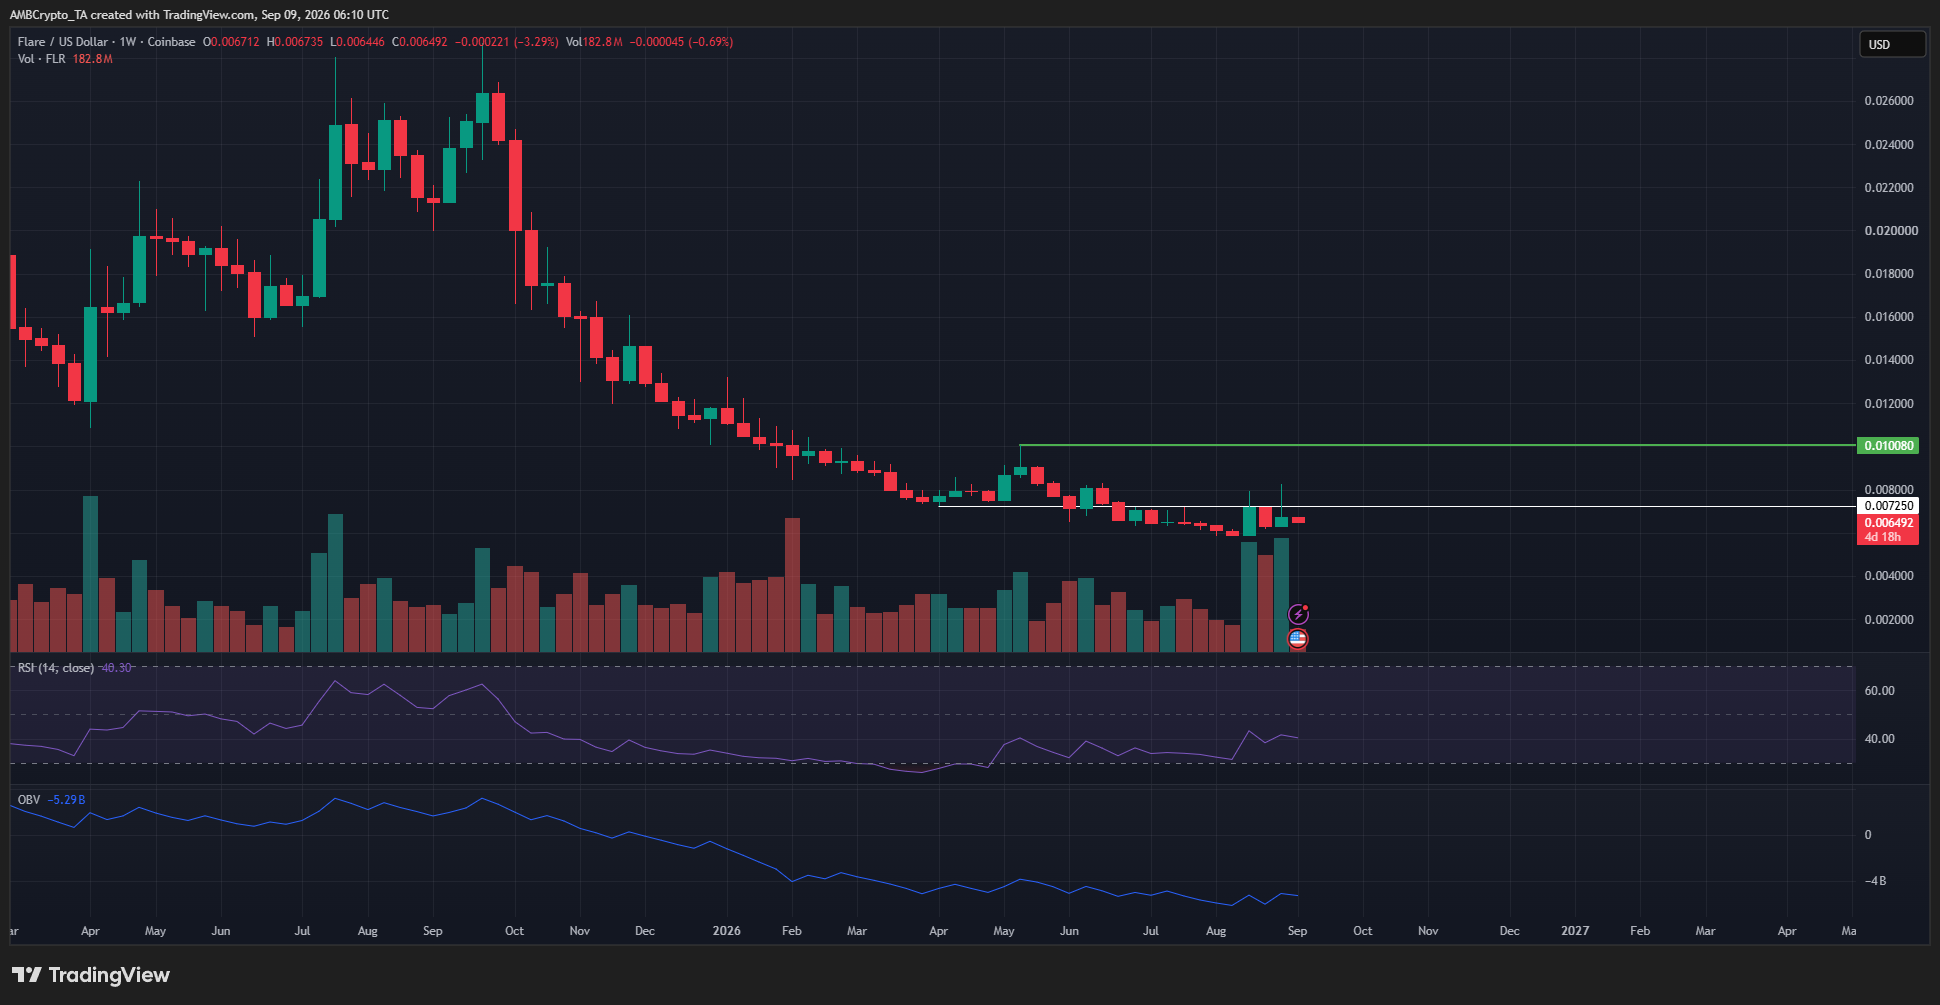
Historical price levels often dictate future technical battlegrounds. In April, the $0.00725 price level served as a robust multi-month support floor, halting aggressive sell-offs and allowing buyers to establish a temporary base. However, market dynamics shifted aggressively in the subsequent months. Flare is currently testing that very same historical support level, but it has now inverted into a formidable overhead resistance barrier.
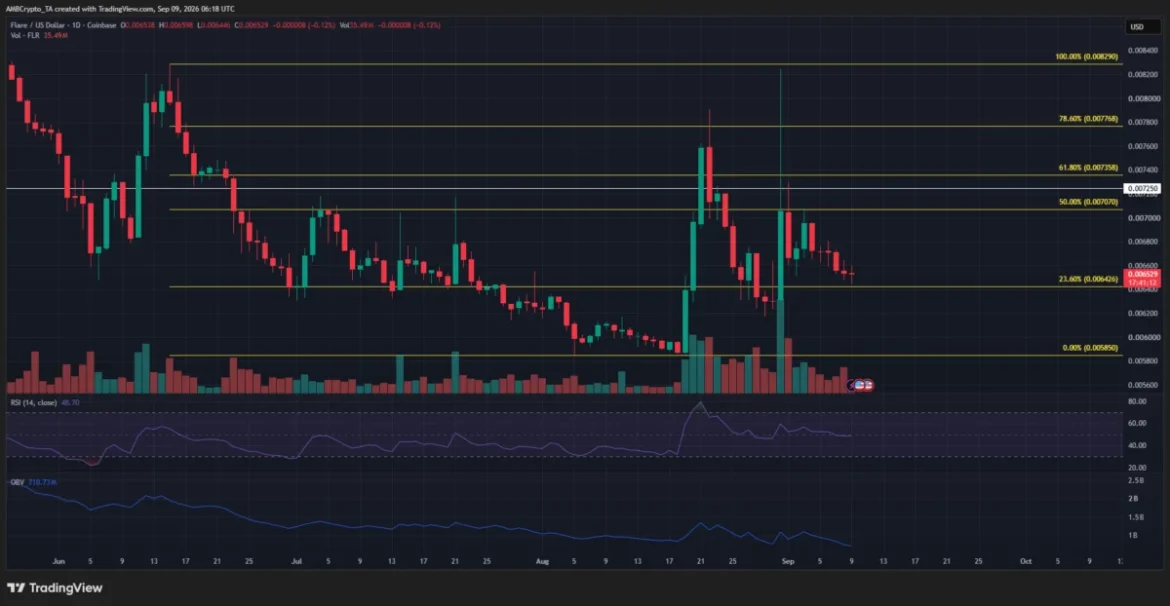
On the daily timeframe, recent price action highlights the dominance of sellers. A prominent swing move saw FLR tumble from $0.00829 down to $0.0585. During August, bulls attempted multiple relief rallies, pushing the asset twice into the $0.0080 region—just above the 78.6% Fibonacci retracement level located at $0.00776. On both occasions, buying pressure vanished, and the market rejected the advances.
Following a local high of $0.00825 recorded on August 31, FLR retraced by roughly 20.9%. Technical oscillators on the daily timeframe continue to favor the bear camp. Market analysts note that as long as the macro downtrend remains intact, the path of least resistance points toward potential new lows, maintaining pressure on the psychological resolve of long-term holders.
Implications for Traders and Ecosystem Stakeholders
The disconnect between Flare’s thriving onchain fundamentals and its lagging market price presents a classic cryptocurrency market conundrum. On one hand, fundamental analysts argue that tokenomics overhauls, reduced inflation, surging burn rates, and high staking participation rates represent foundational health. These factors establish a sustainable baseline for the network, ensuring that when broader market liquidity or sector-specific interest returns, the asset will possess a much healthier economic architecture than it did at launch.
On the other hand, short-to-medium-term traders must respect prevailing market trends. Technical analysts emphasize that ignoring established price structures in favor of fundamental narratives can lead to extended drawdowns. For a meaningful sentiment and technical turnaround to occur, market participants are looking for a definitive structural break. Specifically, a sustained price move and daily close above the $0.00829 threshold would dismantle the current bearish market structure, invalidate lower-high formations, and serve as the preliminary confirmation of a macro trend reversal.
Broader Market Context and Outlook
Flare’s current phase reflects the transitional growing pains experienced by many Layer 1 networks as they mature from speculative venture-backed assets into utility-driven utility layers. The successful execution of FIP 16 demonstrates governance maturity and a willingness by the community to make difficult, long-term economic adjustments.
Whether these structural improvements will eventually translate into price appreciation depends heavily on broader macroeconomic conditions, the overall direction of the digital asset market, and Flare’s ability to continue growing its developer ecosystem and transaction volume. Until the technical indicators on the weekly and daily charts catch up with the positive onchain metrics, FLR remains an asset caught in transition—anchored by robust protocol economics, yet restrained by entrenched market skepticism.
