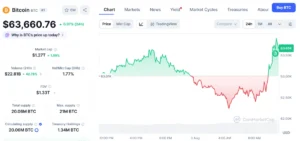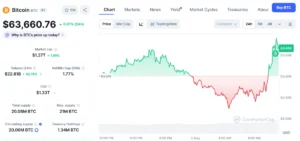
A Bitcoin roadmap, initially published in February by the crypto commentator Klarck on the social media platform X, is experiencing a resurgence in market discourse as Bitcoin’s current price trajectory aligns closely with one of its critical downside projections. This analytical framework, which outlined a potential path for Bitcoin’s price through several distinct phases, is now being revisited by traders and analysts, not as a fresh market signal, but as a compelling example of how historical technical forecasts can gain renewed relevance when market conditions begin to validate their earlier outlined patterns. The roadmap’s resurgence underscores the intricate interplay between historical technical analysis, market psychology, and the ever-evolving dynamics of the cryptocurrency landscape.
The Genesis of the Forecast: Klarck’s February Outlook
In February, amid a period of robust bullish sentiment that saw Bitcoin steadily climbing, Klarck’s post outlined a multi-stage projection for BTC. The roadmap initially anticipated a significant bounce towards the $83,000 mark. Following this projected peak, it forecast a gradual, yet notable, decline into a critical support region identified between $65,000 and $55,000. This predicted downturn was then expected to give way to a roughly two-week accumulation phase, a period characterized by price consolidation and sideways movement as buyers gradually absorb selling pressure. Crucially, the roadmap concluded with a long-term projection for Bitcoin to eventually transition back into a sustained growth trajectory, ultimately targeting an ambitious $140,000 per BTC.
At the time of its initial publication, Bitcoin was trading significantly below the $83,000 target, and the idea of a subsequent drop into the $65,000-$55,000 range might have seemed distant or even unlikely to some market participants. February 2024 was marked by a palpable sense of optimism, largely fueled by the approval of spot Bitcoin Exchange-Traded Funds (ETFs) in the United States, which had opened the floodgates for institutional capital into the crypto market. This influx of investment propelled Bitcoin to new all-time highs, with many analysts and investors anticipating a sustained bull run. The narrative was predominantly bullish, focusing on supply scarcity, increasing adoption, and the upcoming halving event slated for April. Against this backdrop, a forecast detailing a significant pullback, even if followed by higher targets, represented a contrarian view for many, yet it was a view rooted in technical analysis attempting to map out a cyclical market structure.
Bitcoin’s Journey: A Chronological Review
Following Klarck’s February post, Bitcoin’s price indeed embarked on a substantial rally, albeit not reaching the exact $83,000 target specified. Throughout late February and March, Bitcoin surged past its previous all-time high of approximately $69,000, establishing a new peak near $73,700 in mid-March. This upward momentum was driven by continued strong inflows into the newly launched spot ETFs, coupled with anticipation surrounding the halving event, which historically has been a catalyst for significant price appreciation. The market capitalization of Bitcoin swelled, and overall crypto market sentiment remained overwhelmingly positive.
However, as April approached and the halving event materialized, the market began to show signs of consolidation and a cooling off from its frenetic pace. Post-halving, contrary to some immediate expectations of a sharp rally, Bitcoin entered a period of price discovery characterized by increased volatility and a gradual downward trend. This phase saw Bitcoin’s price slowly recede from its March highs, consolidating around the $70,000 level before initiating a more pronounced descent. Over the subsequent weeks, Bitcoin gradually relinquished some of its earlier gains, eventually moving below the $70,000 threshold and continuing its slide. This downward movement has brought Bitcoin’s price progressively closer to the upper boundary of the $65,000-$55,000 zone that Klarck’s roadmap had identified months prior. The market’s current proximity to this range is precisely what has brought the older forecast back into sharp focus, demonstrating how technical roadmaps, when partially validated by price action, can serve as compelling reference points for market participants.
The Critical Juncture: The $65,000-$55,000 Support Zone
The $65,000-$55,000 price range now stands as a pivotal area for Bitcoin. From a technical analysis perspective, this zone carries significant weight. Historically, price levels that have previously acted as strong resistance often transform into robust support once they are decisively broken and retested from above. Bitcoin’s previous all-time high from 2021 was approximately $69,000, making the region just below it a critical area of interest. Furthermore, various Fibonacci retracement levels from the most recent swing low to the all-time high often cluster within or around this zone, reinforcing its technical significance. The psychological aspect also plays a role; round numbers like $60,000 and $55,000 often act as natural support or resistance levels where a significant number of buy or sell orders are placed.
On-chain data further enriches the understanding of this critical zone. Analysis of the Unspent Transaction Output (UTXO) bands can reveal where large clusters of Bitcoin were last moved, indicating the average cost basis for significant portions of the supply. Should a substantial number of coins have changed hands within the $55,000-$65,000 range during previous cycles or recent accumulation, this area could represent strong on-chain support, as holders who acquired Bitcoin at these prices may be less inclined to sell at a loss, thus forming a "holder wall." Metrics like the MVRV Z-Score, which measures Bitcoin’s market value relative to its realized value, can also provide insights into whether the asset is undervalued or overvalued. A move into the lower end of the $55,000-$65,000 range, especially if accompanied by certain on-chain signals, could indicate a healthier valuation for long-term accumulation.
Navigating the Accumulation Phase: What to Look For
Should Bitcoin stabilize within the $65,000-$55,000 zone, Klarck’s roadmap suggests the market would then enter a "two-week accumulation phase." In technical analysis, an accumulation phase is a period typically characterized by a decrease in selling pressure and a gradual increase in buying interest, often leading to sideways price action within a defined range. Key indicators of an accumulation phase include:
- Decreased Volatility: The wild price swings seen during trending markets tend to subside, replaced by tighter, more predictable movements.
- Higher Lows, Lower Highs: While the overall trend is sideways, subtle patterns of higher lows and lower highs within the range can signal a battle between buyers and sellers, with buyers slowly gaining an edge.
- Volume Profile: Volume typically decreases during the consolidation period, indicating a lack of strong conviction from either side. However, bursts of higher volume on upward movements within the range, or "springs" where price briefly dips below support before rapidly recovering, can signal strong absorption by accumulators.
- Order Book Dynamics: A gradual shifting in the order book, with increased bid liquidity at support levels and thinning asks at resistance, can also point towards accumulation.
- On-Chain Metrics: Long-term holder (LTH) accumulation trends, a decrease in exchange outflows, and an increase in dormant supply are all on-chain signals that can corroborate an accumulation phase, indicating that market participants are moving coins off exchanges for holding rather than trading.
For sellers to lose control, sustained periods of selling volume must diminish, and new demand must emerge to absorb any remaining supply. This typically occurs as impatient short-term traders exit their positions, and value-oriented long-term investors begin to step in, seeing the current price as an attractive entry point. If Bitcoin successfully forms such a base, it would lend further credence to the cyclical nature outlined in Klarck’s original roadmap. However, if the price fails to hold the upper end of the zone, particularly the $65,000 level, traders may then shift their focus to the lower boundary near $55,000 as the next potential liquidity target, indicating a more significant market correction might be underway.

The Broader Market Context and Expert Commentary
The current validation of a historical technical roadmap by an X commentator, while intriguing, must be viewed within the broader context of the cryptocurrency market and global macroeconomic conditions. Professional market analysts generally approach such individual forecasts with a degree of caution, preferring to integrate them with a wider array of data points including fundamental analysis, on-chain metrics, macroeconomic indicators, and overall market sentiment. While many acknowledge the utility of technical analysis in identifying potential support and resistance levels, few would base an entire trading strategy on a single, months-old prediction.
Current consensus among many analysts often points to the ongoing influence of macroeconomic factors. The Federal Reserve’s stance on interest rates, inflation data, and the overall health of the global economy continue to exert significant pressure on risk assets, including Bitcoin. A hawkish central bank, signaling higher rates for longer, can create headwinds for cryptocurrencies, as investors might de-risk their portfolios in favor of less volatile assets or those offering guaranteed returns. Conversely, any dovish shifts or signs of economic weakness could potentially reignite demand for Bitcoin as a hedge against inflation or a speculative growth asset.
Comparing Klarck’s roadmap to other prominent market models, such as the Stock-to-Flow model or various logarithmic growth curves, reveals both alignment and divergence. Some long-term models still project significantly higher Bitcoin prices in the coming years, suggesting that any current pullback is merely a temporary fluctuation within a larger bullish trend. However, these models often do not account for short-term market dynamics or specific accumulation phases. The market’s reaction to current events, such as regulatory developments or significant geopolitical shifts, also plays a critical role that no static roadmap can fully encompass.
The Perils and Utility of Historical Roadmaps
There is a clear and inherent danger in attributing excessive weight to an older market forecast. The cryptocurrency market is notoriously dynamic, influenced by a myriad of factors ranging from technological advancements and regulatory changes to shifts in global liquidity and unforeseen ‘black swan’ events. A roadmap, no matter how prescient at one point, is a snapshot in time. Market conditions can change rapidly, rendering even the most meticulously crafted predictions obsolete. For instance, a sudden regulatory crackdown, a major security breach, or an unexpected macroeconomic shock could instantly invalidate even a partially validated roadmap.
However, the utility of revisiting such historical roadmaps lies in their capacity to serve as valuable reference points rather than infallible trading plans. They can help market participants frame the levels that the market is currently testing, offering a historical perspective on potential support or resistance zones. For example, knowing that a significant technical forecast identified the $65,000-$55,000 zone months ago can prompt traders to pay closer attention to how price reacts within that range now. It encourages confirmation from current price action, volume analysis, and on-chain data, rather than blind adherence to the original prediction. This approach fosters a more nuanced and adaptive trading strategy, where old forecasts are used as a guide for inquiry, not as a definitive map. It underscores the importance of continuous analysis and adaptation in a market as volatile and unpredictable as cryptocurrency.
Potential Scenarios Beyond the Current Zone
The market’s reaction to the $65,000-$55,000 zone will dictate Bitcoin’s immediate future trajectory, potentially validating or invalidating the remainder of Klarck’s roadmap.
Scenario 1: The $65,000-$55,000 Zone Holds and Accumulation Occurs.
If Bitcoin manages to find strong support within this range, stabilizes, and exhibits the characteristics of an accumulation phase (decreasing volatility, consolidating volume, signs of long-term holder absorption), the market could then look towards an eventual recovery. The immediate upside targets would likely include a retest of the recent all-time highs around $73,700, followed by psychological resistance levels at $80,000 and potentially the $83,000 target outlined in Klarck’s original roadmap. If these levels are overcome with conviction, the more ambitious $140,000 projection would re-enter the conversation. However, reaching such a target would require sustained institutional inflows, a favorable macroeconomic environment, and continued organic adoption, indicating a strong, fundamental shift in market demand beyond mere technical validation.
Scenario 2: The $65,000-$55,000 Zone Fails to Hold.
Conversely, if Bitcoin breaks decisively below the $55,000 mark, it would signal a more significant market correction and potentially invalidate a substantial portion of Klarck’s bullish long-term outlook. Such a breakdown could trigger further selling pressure as stop-loss orders are hit and market sentiment sours. In this scenario, traders would then look to the next critical support levels. These could include the previous cycle’s peak near $48,000-$50,000, or even deeper support around the $40,000-$42,000 range, which often represents a strong psychological and technical floor. A failure to hold $55,000 would imply that sellers still retain significant control, and the market might require a more prolonged period of capitulation or consolidation before a sustained recovery could begin. This would also likely lead to a re-evaluation of the entire market cycle and the underlying narratives driving Bitcoin’s valuation.
Conclusion
Klarck’s February Bitcoin roadmap has re-emerged as a focal point in the cryptocurrency market, not as a current directive, but as a compelling historical reference point. The market’s current trajectory, which has brought Bitcoin’s price into the initial major downside zone ($65,000-$55,000) identified months ago, serves as a powerful reminder of how technical analysis can sometimes anticipate future market movements. This validation, however, is merely a partial fulfillment of the original forecast. The subsequent phases—the accumulation period and the ambitious $140,000 target—remain highly speculative and contingent on a confluence of ongoing market dynamics, macroeconomic factors, and sustained investor confidence. While such roadmaps offer valuable frameworks for analysis, discerning traders and investors understand the imperative of integrating these historical insights with real-time data, current market sentiment, and robust risk management strategies. The question of whether the rest of Klarck’s projected path will unfold remains an open and closely watched development in the ever-evolving saga of Bitcoin.