A Bitcoin roadmap, originally disseminated by crypto commentator Klarck in February, has garnered renewed attention within the digital asset community as the market’s recent movements closely align with one of its key downside projections. This re-examination of an older forecast underscores the dynamic nature of cryptocurrency analysis, where past predictions can suddenly regain prominence when price action begins to validate their proposed trajectories. The original post, made months ago, outlined a multi-phase market cycle for Bitcoin, including an initial rally, a significant correctional phase, an accumulation period, and a subsequent surge to higher price targets.
The Genesis of Klarck’s Forecast: A Look Back at February’s Outlook
In February, amidst a period of considerable market optimism, the X user known as Klarck (0xklarck) published a detailed Bitcoin roadmap that quickly circulated among crypto enthusiasts. At that time, Bitcoin’s price had been exhibiting strong upward momentum, fueled by a confluence of factors including growing institutional interest, the approval of spot Bitcoin Exchange-Traded Funds (ETFs) in the United States, and anticipation surrounding the upcoming halving event. Klarck’s forecast, therefore, was issued into a generally bullish, albeit sometimes speculative, market environment.
The roadmap posited a specific sequence of events:
- An initial bounce toward $83,000: This projection suggested a continuation of the prevailing bullish trend, pushing Bitcoin to new highs, potentially driven by euphoria and fresh capital inflows.
- A gradual drop into the $65,000-$55,000 region: Following the peak, Klarck envisioned a significant correctional phase, bringing Bitcoin’s price down by a substantial margin. This range was identified as a critical support zone.
- A two-week accumulation phase: After reaching the downside target, the roadmap predicted a period of consolidation and sideways trading, indicative of "smart money" accumulating assets from retail investors who might be capitulating.
- A later transition back into growth: This accumulation phase would then serve as a springboard for the next leg of the bull market.
- An ultimate projection of $140,000 per BTC: This long-term target represented a significant appreciation from the then-current price levels and implied a robust continuation of the bull cycle.
It is crucial to emphasize that this post was not contemporary market commentary at the time of its recent resurgence. Its current relevance stems purely from the uncanny alignment of Bitcoin’s recent price action with its predicted correctional phase. This phenomenon highlights how traders and analysts often revisit historical technical maps when the market starts to mirror earlier forecasts, seeking potential validation for future movements, though never as a definitive guarantee.
Chronology of Market Movements: Validating a Partial Path
Following Klarck’s February projection, Bitcoin did indeed demonstrate significant upward movement, pushing past several key resistance levels. While it may not have precisely touched the $83,000 mark as a definitive peak before the decline, the market experienced a notable rally that brought it into the vicinity of such elevated price points. This initial bullish phase absorbed a considerable amount of market liquidity and generated widespread excitement, consistent with the initial bounce predicted.
However, as is typical in volatile crypto markets, the momentum eventually shifted. After reaching its local peaks, Bitcoin began a correctional descent. This downward trajectory was influenced by a variety of factors, including profit-taking by early investors, macroeconomic uncertainties such as shifting interest rate expectations from global central banks, and potentially some exhaustion from the rapid ascent. Over the ensuing weeks and months, Bitcoin’s price exhibited a gradual, yet persistent, decline.
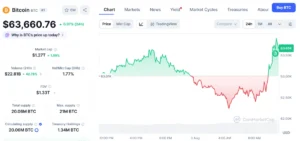
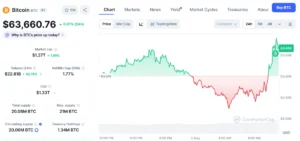
It is this recent downward trend that has brought Bitcoin’s valuation into close proximity with the upper end of Klarck’s identified downside zone: the $65,000-$55,000 region. This convergence has naturally drawn attention back to the older roadmap, as market participants observe the striking accuracy of this particular phase of the prediction. The current market behavior, therefore, provides a compelling case study in how certain technical analyses, even if months old, can prove prescient in guiding expectations for key price levels.
The Critical $65,000-$55,000 Zone: A Deep Dive into Technical Significance
The renewed focus is not primarily on the ambitious $140,000 long-term target, but rather on the immediate significance of the $65,000-$55,000 price band. This zone is not arbitrary; it likely represents a confluence of significant technical and psychological support levels that crypto analysts often consider crucial.
From a technical analysis perspective, the $65,000-$55,000 range holds considerable weight. It could align with several key indicators:
- Previous All-Time Highs (ATHs) and Resistance-Turned-Support: Often, previous all-time highs act as strong support levels once they are decisively broken and retested. Bitcoin’s historical price action frequently shows areas around $65,000-$69,000 serving as significant resistance in past cycles, which, upon being surpassed, could now function as a robust support floor.
- Fibonacci Retracement Levels: This zone might correspond to critical Fibonacci retracement levels (e.g., the 0.382, 0.5, or 0.618 levels) of the previous major rally. These levels are commonly watched by traders for potential reversals or consolidation.
- Volume Profile: High volume nodes within this range on a volume profile chart would indicate areas where a significant amount of trading activity occurred, suggesting strong buyer and seller interest, and thus potential support or resistance.
- Psychological Support: Round numbers and significant price milestones often act as psychological anchors for market participants. The $60,000 and $55,000 marks, in particular, hold such significance.
If Bitcoin’s price manages to stabilize within this range, particularly around the $65,000 mark, it would lend significant credence to Klarck’s roadmap, setting the stage for the predicted "accumulation phase." This would entail Bitcoin ceasing to make lower lows, establishing a tighter trading range, and exhibiting signs that selling pressure is diminishing, with buyers gradually regaining control. Indicators such as declining average daily trading ranges, decreasing volatility, and a flattening or upward-trending On-Balance Volume (OBV) could signal such a phase.
Conversely, should Bitcoin fail to hold the upper boundary of this critical zone, specifically the $65,000 level, market sentiment could quickly turn more bearish. Traders would then likely shift their focus to the lower end of the range, near $55,000, as the next potential liquidity target. A break below $55,000 could trigger further downside, potentially leading to cascading stop-loss orders and a more severe market correction, challenging the premise of the roadmap’s later bullish phases. Such a scenario would necessitate a re-evaluation of the entire forecast, emphasizing the conditional nature of all market predictions.

The Anticipated Accumulation Phase: What Traders Will Be Watching For
The "two-week accumulation phase" outlined in Klarck’s roadmap is a critical element for the subsequent bullish projection. In technical analysis, an accumulation phase typically follows a significant price decline and precedes a new uptrend. It is characterized by specific market behaviors that indicate institutional investors and "smart money" are gradually buying up assets without causing a rapid price increase.
Key characteristics to watch for during an accumulation phase include:
- Decreased Volatility: The wild price swings seen during the decline tend to subside, replaced by more subdued, sideways movement.
- Tighter Trading Range: The price will often consolidate within a relatively narrow band, forming a base.
- Volume Analysis: Volume tends to be lower during the accumulation phase, especially on down moves, indicating a lack of strong selling pressure. Conversely, any minor upward movements might be accompanied by slightly higher volume, signaling renewed buying interest.
- Higher Lows (often subtle): While the overall trend is sideways, discerning traders might observe the formation of slightly higher lows within the consolidation range, hinting at underlying strength.
- Technical Indicator Reset: Oscillators like the Relative Strength Index (RSI) or Stochastic Oscillator will often reset to neutral levels, working off any oversold conditions, and potentially show bullish divergence (price making lower lows while the indicator makes higher lows), signaling impending strength.
If Bitcoin indeed enters and sustains such an accumulation phase within the $65,000-$55,000 zone, it would be a significant development. It would suggest that the market is absorbing the available supply, establishing a new foundation before a potential move higher. The duration of "two weeks" is a specific detail, and while the general concept of accumulation is valid, the exact timeframe can vary. Market participants would be looking for clear signs of demand overcoming supply at these lower levels to confirm the validity of this phase.
Broader Market Context and Influencing Factors
The validity of any technical roadmap is always contingent upon the broader macroeconomic and crypto-specific environment. Since February, several factors have continued to shape the market:
- Macroeconomic Environment: Global inflation trends, central bank monetary policies (particularly the Federal Reserve’s stance on interest rates), and geopolitical stability all play a significant role. Sustained high interest rates or concerns about economic slowdowns can divert capital away from risk assets like Bitcoin.
- Bitcoin Halving Impact: The quadrennial Bitcoin halving event, which reduces the supply of new Bitcoin, occurred earlier this year. Historically, halvings have been precursors to significant bull runs, but their immediate impact can be varied, sometimes followed by a consolidation period.
- ETF Flows: The performance and sentiment surrounding spot Bitcoin ETFs continue to be a major driver. Consistent inflows signal robust institutional demand, while outflows could indicate a shift in sentiment.
- Regulatory Developments: News regarding cryptocurrency regulations in major jurisdictions can significantly impact market confidence and investor behavior.
- On-Chain Data: Beyond price action, on-chain metrics (e.g., exchange flows, whale movements, miner behavior, HODL waves) provide deeper insights into the fundamental health and sentiment of the Bitcoin network. These data points often offer leading or confirming signals that complement price-based technical analysis.
Any of these factors could either support or invalidate the subsequent phases of Klarck’s roadmap. For instance, strong ETF inflows during the predicted accumulation phase would lend significant weight to the idea of renewed institutional interest and potential for an upward move. Conversely, adverse macroeconomic news could easily negate technical patterns.
Why Traders Should Exercise Caution with Older Forecasts
While Klarck’s roadmap has demonstrated a degree of foresight, it is paramount for traders and investors to approach such older forecasts with a healthy dose of skepticism and caution. The inherent dangers include:
- Dynamic Market Conditions: Markets are constantly evolving. Macroeconomic conditions shift, geopolitical landscapes change, liquidity patterns fluctuate, and new narratives emerge. A forecast made months ago, no matter how insightful at the time, cannot account for unforeseen events.
- Confirmation Bias: Once a part of a prediction is validated, there is a psychological tendency to seek further confirmation and give undue weight to the remaining parts, even if current data suggests otherwise.
- Lack of Real-Time Adaptation: Old forecasts are static. Effective trading requires continuous adaptation to new information, real-time price action, and evolving market sentiment.
- The "Self-Fulfilling Prophecy" Effect: Sometimes, widely publicized analyses can become self-fulfilling if enough market participants act on them. However, this effect is often temporary and can lead to rapid reversals once the underlying fundamentals don’t support the move.
Leading industry analysts often advocate for a multi-faceted approach, combining technical analysis with fundamental analysis, on-chain data, and macroeconomic considerations. While Klarck’s roadmap can serve as a valuable "reference point" – framing the levels the market is currently testing – it should never be treated as a definitive "trading plan." Any decisions should be based on current price action, volume, order book data, and prevailing market sentiment, corroborated by independent research and robust risk management strategies.
As Samuel Rae, a seasoned editor in the crypto space, often emphasizes, the editorial process for reputable publications like Bitcoinist is centered on delivering thoroughly researched, accurate, and unbiased content. This commitment to integrity extends to how market analyses are presented, ensuring readers are informed but also aware of the inherent uncertainties in financial predictions.
Implications and Conclusion
The resurgence of Klarck’s February Bitcoin roadmap serves as a fascinating illustration of how historical technical analysis can intersect with present-day market realities. The fact that Bitcoin has approached the predicted $65,000-$55,000 downside zone has undeniably placed the roadmap back into the spotlight, sparking discussions and renewed interest among traders and analysts.
For now, the critical juncture lies within this specific price band. Whether Bitcoin can find strong support, initiate the predicted accumulation phase, and subsequently embark on the path towards Klarck’s ambitious $140,000 target remains an open and intensely watched question. Market participants will be scrutinizing every candlestick and volume spike within this range, seeking confirmation or invalidation of the roadmap’s next phases.
Ultimately, while such historical analyses offer valuable perspectives and potential frameworks for understanding market cycles, the ever-evolving nature of the cryptocurrency landscape demands constant vigilance and a reliance on current data. Klarck’s roadmap has proven prescient in identifying a key correctional zone, but the full unfolding of its ambitious trajectory will depend entirely on how Bitcoin navigates the challenges and opportunities that lie ahead, confirming that even the most astute predictions are subject to the unpredictable forces of the market.