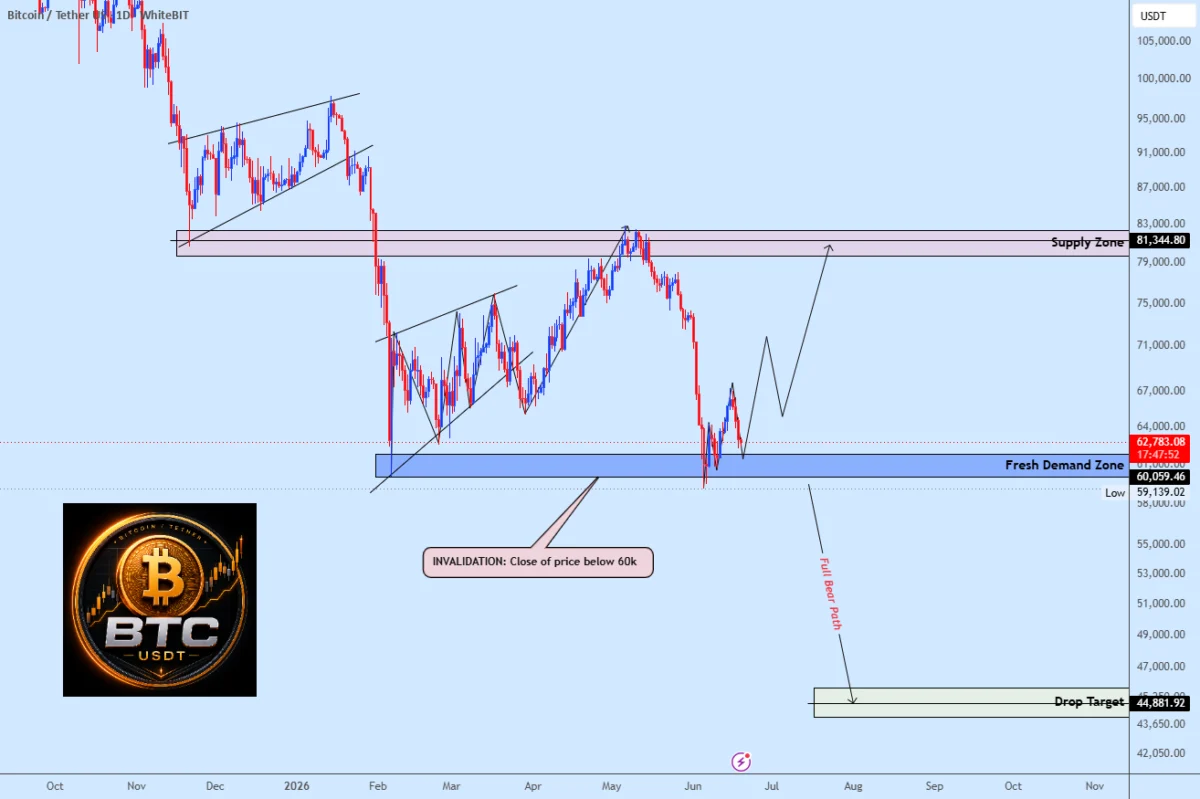
Bitcoin, the flagship cryptocurrency, is currently navigating a critical juncture, finding itself once again at a price level that holds significant psychological and technical importance for traders and investors alike. As of a TradingView analysis published on June 20, the BTC/USDT trading pair has approached a fresh demand zone. This area is being closely watched as it is expected to dictate the cryptocurrency’s immediate trajectory, potentially shaping its next major market move. The analyst behind the observation, known on TradingView as weslad, characterized this zone as a region where significant buyer interest has historically emerged, but crucially, it is also a level that cannot sustain a decisive breakdown without triggering substantial negative repercussions.
The Critical $60,000 Support Level
The $60,000 mark has long been considered a pivotal psychological barrier for Bitcoin. Beyond its round-number appeal, this level has demonstrated historical significance as a point where buying pressure has tended to outweigh selling pressure, acting as a floor for price appreciation. According to weslad’s analysis, the current demand zone encompasses this critical $60,000 price point. The implication is clear: a sustained defense of this area is crucial for maintaining a bullish outlook for Bitcoin. Conversely, a decisive breach below this level could signal a significant shift in market sentiment and potentially lead to a steeper price correction.
The analyst’s chart summary highlights that if Bitcoin manages to hold and respect this current demand zone, the probability of a recovery towards the $81,000 supply area remains considerably high. This projected upward movement would represent a return to levels seen prior to a recent decline and could potentially trigger a significant liquidity grab as buyers step in to capitalize on perceived undervaluation. Such a scenario would reinforce the prevailing bullish narrative that has characterized much of Bitcoin’s performance in recent market cycles.
Implications of a Breakdown Below $60,000
The warning accompanying the analysis is unequivocal. Weslad explicitly identifies $60,000 as the "line in the sand" for bullish sentiment. A decisive close below this threshold on significant trading volume would, according to the analysis, invalidate the current bullish thesis and expose Bitcoin to the risk of a more profound and potentially prolonged breakdown.
The significance of this level extends beyond simple price observation. When a widely recognized support level like $60,000 is tested, it often becomes a focal point for a large number of traders. A failure at this level can trigger a cascade of automated stop-loss orders from leveraged positions, forcing liquidations and accelerating downward price momentum. Furthermore, such a breakdown can lead to a rapid shift in overall market sentiment, as traders reassess their positions and a more cautious or bearish outlook takes hold. Conversely, the successful defense of this zone provides a strong argument for bulls, suggesting that the recent sell-off may have reached an exhaustion point, paving the way for a renewed upward trend.
The Path to Recovery: A Need for Confirmation
While the $81,000 upside target is an attractive prospect for investors and traders anticipating a rebound, Bitcoin’s ability to reach this level is not guaranteed. The cryptocurrency must first demonstrate its resilience by defending the $60,000 support. Following this, a successful reclamation of nearby resistance levels will be necessary to confirm the strength of buyer demand. Ultimately, bulls will need to showcase that the defensive reaction at $60,000 can transition from a mere price stabilization into a sustainable trend reversal.

Until such confirmation is evident, the current market setup is best understood as a critical binary support test. The outcome hinges on whether Bitcoin can hold the current demand zone, thereby preserving the case for a recovery, or decisively lose it, which would likely signal the onset of a deeper correction.
Historical Context and Market Dynamics
The current situation echoes previous periods in Bitcoin’s history where crucial support levels have been tested. Throughout its volatile journey, Bitcoin has demonstrated a remarkable ability to rebound from significant drawdowns, often characterized by sharp corrections followed by V-shaped recoveries. These patterns are frequently driven by a combination of factors, including macroeconomic sentiment, regulatory developments, institutional adoption, and retail investor interest.
In the lead-up to this critical $60,000 test, Bitcoin experienced a period of considerable price appreciation, reaching new all-time highs in late 2021 and again in early 2024. These rallies were often fueled by a combination of increased institutional interest, particularly through the approval of spot Bitcoin ETFs in the United States, and a general bullish sentiment surrounding digital assets. However, the cryptocurrency market is inherently cyclical, and periods of rapid growth are often followed by periods of consolidation or correction as profit-taking occurs and market participants re-evaluate their positions.
The $60,000 level, in particular, has served as both a ceiling and a floor at various points in Bitcoin’s price history. Its re-emergence as a critical support level underscores the cyclical nature of its market dynamics and the importance of key price points in shaping investor sentiment and trading strategies.
Supporting Data and Expert Analysis
To further contextualize the current situation, it is useful to examine broader market data and the sentiment surrounding Bitcoin. On-chain analytics platforms provide valuable insights into the behavior of Bitcoin holders. For instance, metrics such as the Net Unrealized Profit/Loss (NUPL) can indicate whether the market is in a state of euphoria or capitulation. Similarly, the Mayer Multiple, which compares the current price of Bitcoin to its 200-day moving average, can help identify periods of potential overvaluation or undervaluation.
The analyst weslad’s observation is rooted in technical analysis, a discipline that relies on historical price data and trading volumes to predict future price movements. The concept of a "demand zone" is fundamental to this approach, representing a price range where buying pressure is expected to be strong enough to absorb selling pressure. The identification of such zones is often based on patterns observed in price charts, including candlestick formations, support and resistance levels, and trading volume spikes.
The reference to a potential "liquidity grab" at the $81,000 level also points to a common trading strategy. In a market prone to volatility, large price swings can create opportunities for astute traders to enter positions at advantageous prices. If Bitcoin were to experience a brief dip below a key support level before rebounding, it could trigger stop-loss orders, pushing prices down further momentarily and allowing strategic buyers to accumulate Bitcoin at a discount before the price resumes its upward trajectory.

Broader Market Impact and Implications
The performance of Bitcoin has significant ripple effects across the broader cryptocurrency market. As the largest and most influential cryptocurrency, Bitcoin often dictates the trend for altcoins. A sustained decline in Bitcoin’s price can lead to a widespread sell-off in the altcoin market, while a strong recovery in Bitcoin can fuel rallies in other digital assets.
The current test of the $60,000 level also has implications for institutional investors and the broader adoption of cryptocurrencies. A decisive breakdown could lead some institutions to pause or reconsider their exposure to Bitcoin and other digital assets, potentially slowing down the pace of mainstream adoption. Conversely, a successful defense and subsequent recovery would likely reinforce confidence among institutional players, potentially attracting further investment and bolstering the cryptocurrency ecosystem.
Furthermore, the regulatory landscape continues to play a crucial role in the cryptocurrency market. Developments in regulatory frameworks, both domestically and internationally, can significantly influence investor sentiment and market stability. As Bitcoin approaches critical price levels, any pronouncements or actions from regulatory bodies could further impact its trajectory.
Conclusion: A Pivotal Moment for Bitcoin
In summary, Bitcoin is at a critical inflection point, with the $60,000 level serving as a crucial demand zone that will likely determine its short-to-medium term price direction. The analysis from TradingView suggests that holding this level is paramount for maintaining a bullish outlook and potentially paving the way for a recovery towards $81,000. However, a decisive breach below $60,000 would invalidate bullish arguments and expose Bitcoin to further downside.
The market is keenly observing this pivotal moment, as it will not only shape the immediate future of Bitcoin but also have broader implications for the entire cryptocurrency ecosystem. The coming days and weeks will be crucial in determining whether bulls can defend this vital support or if bears will gain the upper hand, leading to a more significant correction. Investors and traders will be looking for clear confirmation of either a sustained upward trend or a further downward movement as they navigate this period of heightened uncertainty and potential opportunity.
This report is based on information from TradingView user weslad, as published on June 20. The analysis was conducted by the News Desk and edited by Samuel Rae.