
The current trajectory of Bitcoin’s price action has shifted away from the speculative euphoria that characterized much of the previous year, settling instead into a period of consolidation that analysts are identifying as a prime Dollar-Cost Averaging (DCA) zone. This specific technical region, visible on long-term monthly charts, has historically served as a precursor to significant market recoveries. As Bitcoin trades around the $62,800 level, market participants are weighing this structural support against emerging bearish indicators, including softening ETF inflows and shifts in on-chain liquidity.
Historical Context and Structural Parallels
To understand the current market position, one must look at the structural echoes of previous cycles. The concept of a "DCA zone" is rooted in the idea that long-term institutional and retail investors increase their buying activity when sentiment hits its nadir.
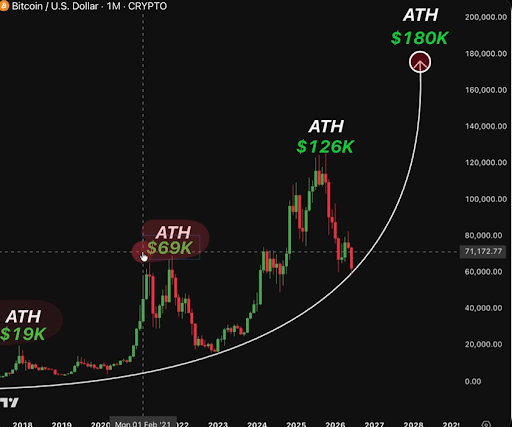
In 2019, following the catastrophic decline from the 2017 highs—where Bitcoin lost approximately 83% of its value—the market languished in a depressed accumulation phase. This period was marked by pervasive pessimism, with many market observers declaring the asset "dead." However, this exact period of stagnation provided the foundation for the subsequent bull run that culminated in the 2021 peak of $69,000.
Similarly, the 2022 market cycle, catalyzed by the collapse of the FTX exchange, forced a massive wave of capitulation. Bitcoin’s price plummeted to roughly $15,500, a level that many assumed would be a gateway to further downside. Instead, that floor became the launchpad for a 600% rally, eventually driving the asset to a new record high of over $126,000 by October 2025.

Analyst Ardizor has pointed to these historical parallels, suggesting that the current chart formation on the monthly timeframe mirrors these past cycles. By respecting the curved support levels that defined the 2019 and 2022 bottoms, Bitcoin is currently signaling a structural alignment that suggests the asset is in a "transition phase" rather than a terminal decline.
Analyzing the Data: On-Chain Metrics and Liquidity
While the technical structure suggests a potential for accumulation, the fundamental data presents a more nuanced reality. The Bitcoin Realized Cap—a metric that values each UTXO (Unspent Transaction Output) based on the price at which it last moved—has seen a contraction of roughly $12 billion since its mid-May peak. This indicates that capital is flowing out of the network, a phenomenon often associated with investors locking in losses or reallocating to other assets.
Furthermore, the PnL (Profit and Loss) Index, which aggregates various market health indicators, suggests that the market has not yet reached a definitive "bottom." This index is currently in a transitional state, reflecting a tug-of-war between long-term holders (HODLers) who are unwilling to sell and short-term traders who are reacting to macroeconomic pressures.
The role of Spot Bitcoin ETFs, which were a primary driver of the 2024 and early 2025 rallies, has also shifted. While these funds provided the liquidity necessary to break past previous all-time highs, current inflows have become more volatile. This volatility has forced analysts to reconsider whether the "institutional wall of money" is sufficient to support the current price levels if retail interest continues to wane.
The Macroeconomic Environment and Investor Sentiment
The broader financial climate plays a significant role in the current accumulation narrative. With central banks maintaining a cautious stance on interest rates and global liquidity conditions tightening, Bitcoin is increasingly sensitive to risk-on sentiment in traditional equity markets.

When sentiment is at its lowest, market psychology often undergoes a "washout" phase. During these periods, the fear-driven selling pressure from weak hands is absorbed by long-term, price-insensitive buyers. This is the essence of the DCA strategy: ignoring short-term price fluctuations to build a position over a longer duration. If Bitcoin continues to hold its current support levels, it suggests that the market is currently in this "washout" phase, where the supply of Bitcoin is being transferred from reactive traders to proactive long-term investors.
Implications for Market Participants
The implications of this structural phase are twofold. For long-term investors, the current price range offers an opportunity to accumulate assets at a discount relative to the highs seen in late 2025. This strategy is predicated on the assumption that Bitcoin’s historical cycle of "four-year" patterns—defined by halving events and subsequent supply shocks—remains intact.
Conversely, for short-term traders, the lack of immediate upward momentum presents a risk. If the $62,000 support level is breached, it could trigger a secondary wave of liquidations, potentially testing lower technical floors. The market is currently in a state of "wait and see," where the validity of the current support is being tested by daily inflows and outflows.
Expert Perspectives on the Current Cycle
Market analysts are divided on the speed of a potential recovery. Some experts argue that the current cycle is unique due to the unprecedented level of institutional integration through ETFs, which may dampen the extreme volatility seen in previous cycles. Others contend that the cycle is merely following the established path, albeit with higher price tags and larger liquidity pools.
"The current market environment is a classic example of a cycle transition," noted one industry analyst. "We are seeing the exhaustion of the post-rally euphoria, and we are moving into the grind. The fact that the price is respecting long-term support is a bullish signal, even if the short-term indicators suggest we have more work to do before a new breakout."
Looking Ahead: The Path to Recovery
The path to a new all-time high will likely require a shift in both macroeconomic conditions and network activity. A return to expansionary monetary policy, or a renewed surge in demand from institutional portfolios, would likely be the catalyst to break the current accumulation structure.
In the immediate term, market participants will be watching the interaction between Bitcoin’s price and its realized value. If the Realized Cap stabilizes and begins to turn upward, it would provide a strong signal that the "capitulation" phase is over. Until then, the market remains in a delicate balance.
The current configuration is a stark reminder that market cycles are not linear. They are defined by periods of extreme optimism and extreme fear. The current "DCA zone" is effectively the market’s way of clearing out the speculative froth, ensuring that the next upward movement is built on a more resilient and committed investor base. Whether this leads to a rapid reversal or a prolonged period of sideways movement remains the central question for the remainder of the year.
As the industry continues to monitor these developments, the focus remains on the integrity of the support structures established over the last decade. Regardless of the short-term noise, the long-term thesis for Bitcoin continues to be tested by these cycles, with each period of accumulation providing the necessary tension for the next phase of market expansion. Investors are advised to focus on the long-term technical indicators rather than the daily market sentiment, which remains highly reactive to news flows and liquidity shifts. The coming months will be critical in determining whether this accumulation zone serves as the bedrock for the next cycle or if further market correction is required to flush out remaining systemic leverage.