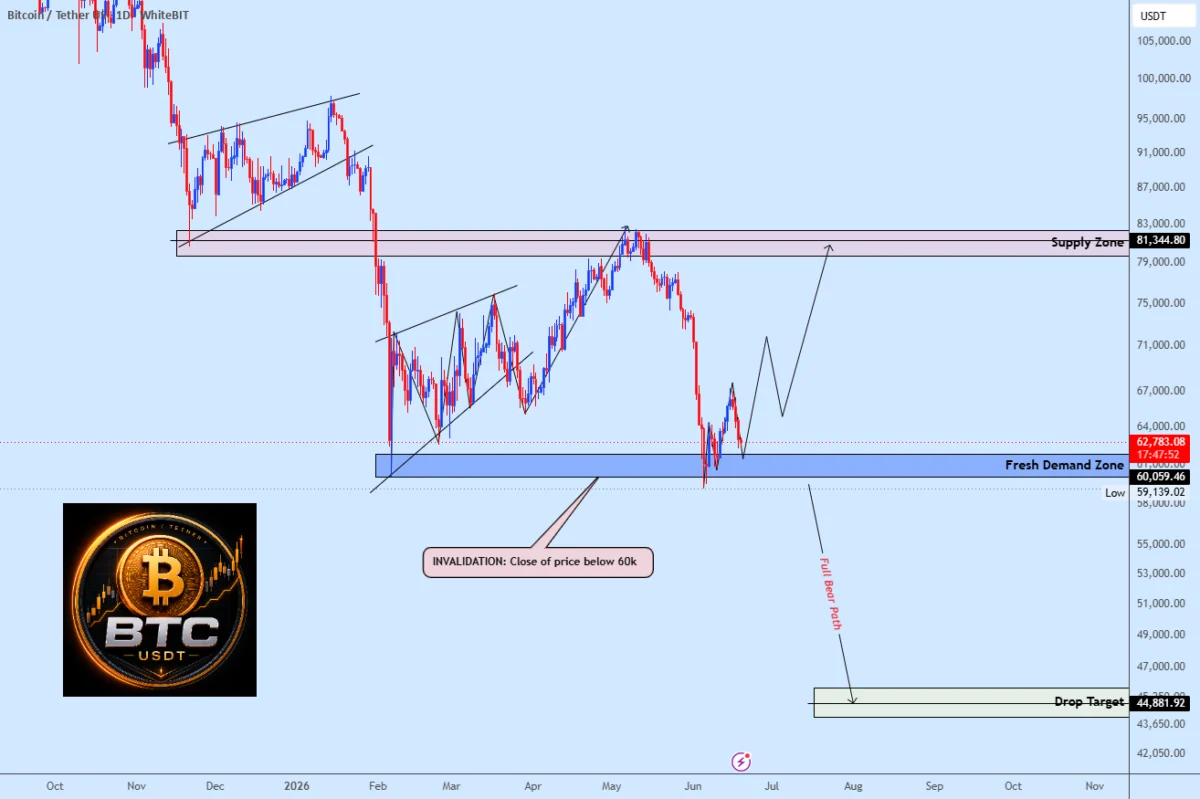
Bitcoin is currently navigating a pivotal technical juncture as the world’s largest cryptocurrency tests the psychologically and structurally significant $60,000 support level. This price point has emerged as the primary focal point for institutional investors, retail traders, and quantitative analysts alike, serving as a binary indicator for the market’s medium-term trajectory. Recent technical analysis provided by market observer weslad on the TradingView platform highlights that Bitcoin (BTC) has entered a critical demand zone, a region characterized by historical buy-side interest that must now act as a floor to prevent a broader structural breakdown.
The current market environment is defined by heightened volatility and a struggle for dominance between bearish liquidation pressure and bullish accumulation. As Bitcoin hovers near this threshold, the stakes are elevated. A failure to hold the $60,000 mark could trigger a cascade of automated stop-loss orders, potentially accelerating a downward move into lower liquidity pools. Conversely, successful consolidation within this zone could provide the necessary foundation for a recovery toward the $81,000 supply area, a level representing the origin of the most recent significant decline.
The Technical Significance of the $60,000 Threshold
In the realm of technical analysis, round numbers like $60,000 often function as psychological magnets. However, the importance of this level extends beyond mere human sentiment. It represents a "demand zone"—a specific price range where, according to order book depth and historical volume profile data, a substantial cluster of buy orders has been placed.
For many market participants, the $60,000 level represents the "line in the sand." When an asset tests such a zone repeatedly, the integrity of the support tends to weaken with each subsequent touch. However, if the asset exhibits signs of exhaustion among sellers—where the volume of selling pressure begins to wane while price remains steady—it often signals an impending reversal. The analysis by weslad suggests that Bitcoin is currently in this state of exhaustion, where the burden of proof lies with the bulls to demonstrate that they can reclaim the initiative.
Chronology of Recent Price Action
To understand the current volatility, one must look at the broader timeline of Bitcoin’s price performance throughout the second quarter of the year. Following a series of macroeconomic shifts, including interest rate policy discussions from the Federal Reserve and fluctuating inflows into spot Bitcoin Exchange-Traded Funds (ETFs), BTC experienced a period of correction.

In early June, the market saw a notable deviation from the bullish trends observed in the first quarter. As prices drifted lower from the $70,000 range, market participants began looking for a "retest" of previous breakout levels. By mid-June, the downward momentum intensified, driven by a combination of profit-taking and external market pressures. By June 20, the price had descended into the current demand zone, marking a critical transition point. This period of consolidation has been characterized by indecisive trading sessions, as investors weigh the potential for a "liquidity grab"—a market maneuver where price dips below a support level to trigger stop-losses, only to rebound sharply—against the risk of a sustained bearish trend.
Supporting Data and Market Dynamics
The current market structure is heavily influenced by the behavior of Bitcoin ETF holders and derivative traders. On-chain data indicates that while long-term holders (HODLers) remain relatively firm in their convictions, short-term speculators are currently the primary drivers of the recent volatility.
Liquidity remains a primary concern for institutional market makers. When Bitcoin approaches $60,000, the concentration of leveraged positions increases significantly. Data from various derivatives exchanges shows a dense cluster of liquidation levels just below the $59,000 mark. This is a double-edged sword: a "flush" of these positions could provide the liquidity necessary for large-scale institutional buyers to enter the market at a discount, but it also increases the risk of a "flash crash" if market depth is insufficient to absorb the sell-side pressure.
Furthermore, the relationship between Bitcoin and the broader equity markets, particularly the tech-heavy Nasdaq, has remained correlated. As tech stocks face their own regulatory and economic headwinds, Bitcoin has mirrored this caution. Analysts suggest that until there is a clear decoupling—or a decisive shift in global liquidity conditions—Bitcoin will likely remain range-bound, oscillating between the current $60,000 support and resistance levels situated closer to its all-time highs.
Implications of a Decisive Breakdown
Should Bitcoin fail to maintain the $60,000 support level on a closing basis, the implications for the market are significant. A breach would invalidate the current bullish thesis that has underpinned the market since the start of the year. Historically, when a high-profile support level is broken, it often leads to a rapid re-evaluation of valuation models.
A "decisive" move below $60,000 would likely force traders to shift their targets toward the $52,000 to $55,000 range, which serves as the next significant structural support. This would be interpreted as a deep correction, potentially shaking out weaker hands and resetting the market’s leverage profile. In such a scenario, the recovery to $81,000 would be delayed, as the market would need to spend weeks or months building a new base of support.

The Bullish Case: Reclaiming Resistance
Conversely, if the $60,000 level holds, the path to recovery involves a multi-step process. First, the market requires a period of stabilization, where volatility contracts and volume begins to favor the buyers. Second, Bitcoin must reclaim nearby resistance levels, specifically the $68,000 and $72,000 marks, which have acted as major hurdles during the recent decline.
The target of $81,000 is not merely a random figure; it represents the supply zone where the selling pressure originated during the last major leg down. Reaching this target would require a significant shift in market narrative, likely triggered by positive catalysts such as favorable inflation data, increased institutional adoption, or a change in central bank monetary policy. Until such catalysts emerge, the market will likely view any move toward $81,000 as a test of the supply side, where sellers will again attempt to reassert control.
Institutional and Expert Perspectives
While retail sentiment is often captured by social media trends, the institutional view remains focused on risk-adjusted returns. Many analysts note that the current environment is a classic "test of patience." Institutional desks have been observing the $60,000 level as a validation of the current bull cycle. If the level holds, it reinforces the belief that the current market cycle is simply experiencing a mid-cycle correction rather than the start of a prolonged bear market.
"The technicals are clear," noted one industry observer familiar with the current price action. "We are in a zone where the market must decide its direction. Holding $60,000 provides the foundation for the next leg up, but the market cannot afford a breakdown of this magnitude without significant consequences for overall sentiment."
Conclusion: A Binary Outcome
The coming days will be critical for Bitcoin. The current situation serves as a stark reminder of the volatility inherent in digital asset markets. As investors watch the $60,000 level, the focus should remain on volume, price action, and macroeconomic signals.
If the current demand zone acts as a launchpad, the recovery case remains firmly in place, pointing toward a retest of the $81,000 supply area. If, however, the level fails to hold, the market will enter a period of defensive posturing. In either case, the $60,000 test is a defining moment for the 2025-2026 market cycle, serving as a filter for investors and a litmus test for the resilience of the current bull trend. Traders are advised to monitor the daily and weekly close, as these will provide the final verdict on whether the current support zone can successfully defend the broader bullish outlook.