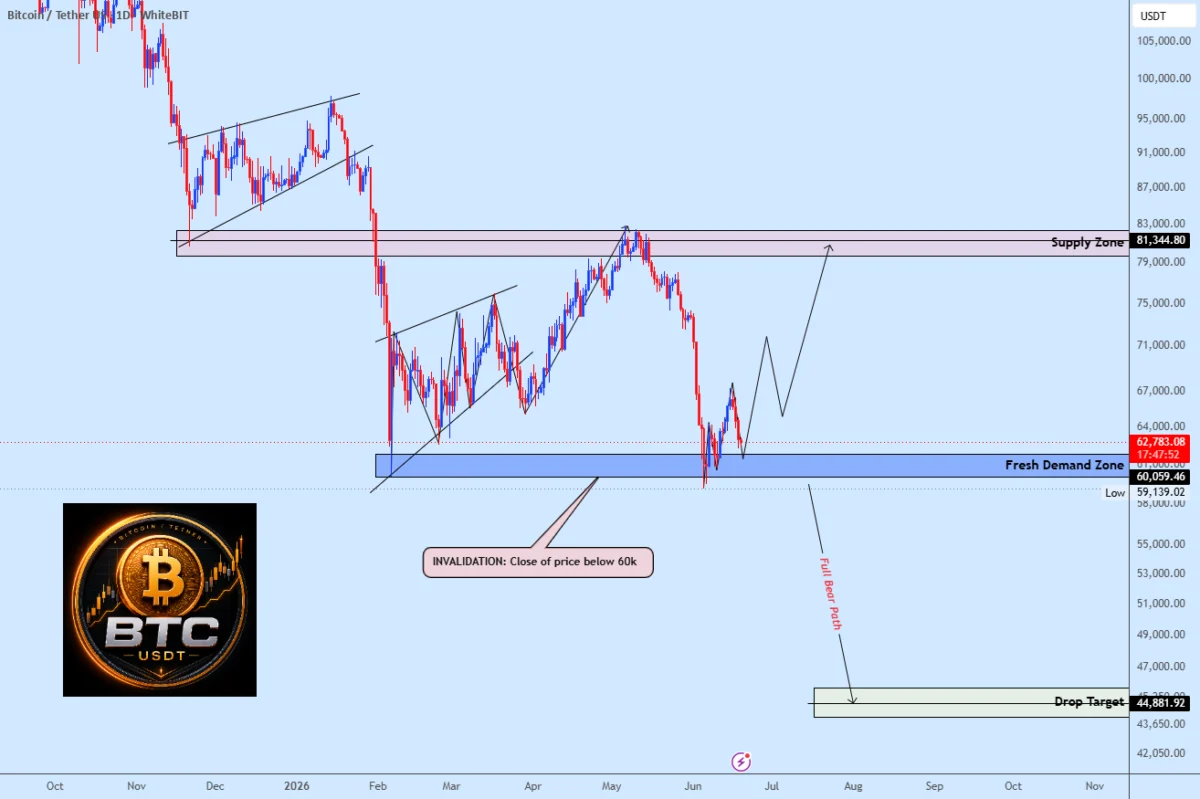
Bitcoin has returned to a critical juncture, a price level widely regarded by traders and analysts as both psychologically and technically significant. On June 20, a TradingView analysis by the user weslad highlighted that BTC/USDT had entered a new demand zone, a development that could dictate the cryptocurrency’s immediate trajectory. This zone is characterized by historical buying interest, but its ability to withstand selling pressure is now being rigorously tested.
The $60,000 Demand Zone: A Battleground for Bulls and Bears
The $60,000 mark has long been a psychological barrier and a key support level for Bitcoin. Its current retest signifies a crucial moment for the digital asset’s market sentiment. The analysis by weslad, shared on TradingView, posits that this demand zone represents an area where buyers have previously stepped in to absorb selling pressure. However, the integrity of this zone is now paramount; a decisive failure to hold this level could trigger significant downward price action.
According to the chart summary provided by weslad, as long as Bitcoin remains above this established demand zone, there is a strong probability of a recovery towards the $81,000 supply area. This potential upward movement would signify a return to prices seen before the recent decline and could potentially lead to a "liquidity grab" – a scenario where strong buyer demand overtakes sellers, pushing prices higher. The $81,000 level, in this context, represents a significant resistance area where selling pressure has historically emerged.
Technical Indicators and Market Sentiment
The current price action around $60,000 is being closely monitored by a broad spectrum of market participants, from retail investors to institutional traders. Technical analysts are dissecting various indicators to gauge the strength of the current support. These may include:
- Volume Analysis: Examining trading volumes at the $60,000 level can reveal the conviction of buyers. High volume with price holding steady or increasing suggests strong buying interest. Conversely, high volume with a breakdown below the level indicates significant selling pressure.
- Moving Averages: Key moving averages, such as the 50-day, 100-day, and 200-day moving averages, often act as dynamic support and resistance levels. Their position relative to the current price can provide further context on the prevailing trend.
- Relative Strength Index (RSI): The RSI is a momentum oscillator that measures the speed and change of price movements. Readings below 30 often indicate oversold conditions, while readings above 70 suggest overbought conditions. Traders will be looking at the RSI to see if it signals a potential bounce or continued downward momentum.
- Fibonacci Retracement Levels: These are often used to identify potential support and resistance levels based on previous price swings. Key Fibonacci levels around the $60,000 mark could be critical in determining the next move.
The broader market sentiment surrounding Bitcoin at this critical juncture is a mix of cautious optimism and palpable concern. While some believe the current dip presents a buying opportunity, others are wary of a potential deeper correction, especially if the $60,000 support fails. The recent performance of the cryptocurrency market, characterized by periods of volatility, has instilled a sense of vigilance among investors.

The Peril of a Breakdown Below $60,000
The warning from weslad is unequivocal: a decisive close below the $60,000 level would severely damage the bullish outlook for Bitcoin. This level is not merely a psychological round number; it represents a significant confluence of technical factors and a focal point for trading strategies.
A breach of $60,000 could trigger a cascade of sell orders. Many traders, particularly those employing stop-loss orders, would be automatically liquidated, exacerbating the downward pressure. This could lead to a rapid price decline as the market shifts from a defensive posture to one of capitulation. Such a scenario would likely signal a shift in market sentiment, potentially ushering in a period of prolonged bearishness.
The implications of such a breakdown extend beyond short-term price movements. A sustained drop below this key level could deter new investors from entering the market and could lead to existing holders re-evaluating their positions, potentially leading to further selling. The narrative of Bitcoin as a rapidly appreciating asset could be temporarily overshadowed by concerns about its volatility and the potential for significant losses.
The Path to Recovery: Demanding Confirmation
While the $81,000 area presents an attractive target for a potential recovery, Bitcoin must first demonstrate its ability to defend the $60,000 support. Bulls will need to not only hold this crucial level but also reclaim nearby resistance areas to build confidence. The key will be to observe if the current defensive reaction can transform into a genuine trend reversal, rather than a temporary reprieve.
Until this upward momentum is confirmed by sustained buying pressure and a clear break above resistance levels, the current setup is best understood as a critical support test. The outcome of this test will likely determine Bitcoin’s short-to-medium term trajectory.
- Scenario 1: Support Holds: If Bitcoin successfully defends the $60,000 demand zone, it would validate the bullish argument that the recent sell-off has reached an exhaustion point. This could pave the way for a retest of higher price levels, potentially targeting the $81,000 area. Confirmation of this scenario would involve a clear upward trend, increasing trading volumes on upward price movements, and a sustained break above intermediate resistance levels.
- Scenario 2: Support Fails: A decisive break below $60,000 would signal a bearish continuation. This would likely lead to further price declines, with traders looking for subsequent support levels. The market might begin to price in a more significant correction, potentially testing levels much lower than $60,000. This scenario would be characterized by increasing selling pressure, high trading volumes on downward price movements, and a breakdown of other technical indicators.
Broader Market Implications and Investor Sentiment
The outcome of Bitcoin’s test at $60,000 has broader implications for the entire cryptocurrency market. As the flagship digital asset, Bitcoin’s price movements often influence the direction of altcoins. A strong recovery for Bitcoin could instill confidence across the altcoin market, leading to a broader rally. Conversely, a significant breakdown in Bitcoin could trigger a widespread sell-off in other cryptocurrencies, as investors seek to de-risk their portfolios.

The current environment is also shaped by macroeconomic factors. Inflationary pressures, interest rate policies from central banks, and geopolitical events can all influence investor appetite for riskier assets like cryptocurrencies. Traders and analysts will be closely watching these broader economic indicators for clues about the overall market sentiment.
Furthermore, the increasing institutional adoption of Bitcoin, through avenues like Bitcoin exchange-traded funds (ETFs), adds another layer of complexity. Large institutional players often have longer-term investment horizons and may view significant price dips as accumulation opportunities. Their actions, or inactions, at these critical price levels can have a substantial impact on market dynamics.
Looking Ahead: Awaiting the Signal
The cryptocurrency market is at a pivotal moment. The $60,000 level for Bitcoin represents more than just a number; it is a critical inflection point that will likely shape the narrative for the coming weeks and months. Traders and investors are holding their breath, awaiting a clear signal that will determine whether the market embarks on a path of recovery or faces a more significant correction. The coming days will be crucial in deciphering the true strength of Bitcoin’s support and its potential to regain upward momentum.
This analysis is based on information from the TradingView chart by user weslad. The report was compiled by the Bitcoinist News Desk and edited by Samuel Rae.