
Cardano (ADA) has demonstrated notable resilience across recent trading sessions, registering a 2.42% price increase over a 24-hour window alongside a corresponding 2.5% expansion in Open Interest. This steady performance contributes to a broader monthly gain of 17.7%, positioning the altcoin as an asset of interest for both retail and institutional market participants navigating a shifting macroeconomic landscape.
The recent upward movement unfolded concurrently with Bitcoin (BTC) making a decisive push above the $80,000 threshold. Although Bitcoin has since retreated below this crucial psychological milestone, Cardano’s native token has managed to defend the $0.20 support zone effectively. Despite this relative strength, technical indicators across multiple timeframes present a nuanced picture. While short-term momentum remains encouraging, critical overhead resistance levels continue to challenge the prospect of a sustained, long-term bullish reversal.
Background Context and Market Dynamics
The broader cryptocurrency market has experienced heightened volatility driven by shifting macroeconomic expectations, regulatory developments, and changing liquidity cycles. Within this environment, Cardano has historically tracked broader market correlations while attempting to carve out an independent trajectory through ecosystem upgrades and decentralized governance milestones.
The current price action reflects a tug-of-war between accumulation phases and profit-taking behaviors. As capital rotates dynamically between Bitcoin, Ethereum, and major alternative layer-1 protocols, Cardano’s ability to hold foundational support levels—such as the $0.20 mark—has served as a stabilizing factor for holders weathering market corrections. However, underlying network metrics and order book dynamics reveal that market participants remain cautious, weighing recent multi-week gains against persistent macroeconomic uncertainties.
Chronology of the Recent Rally
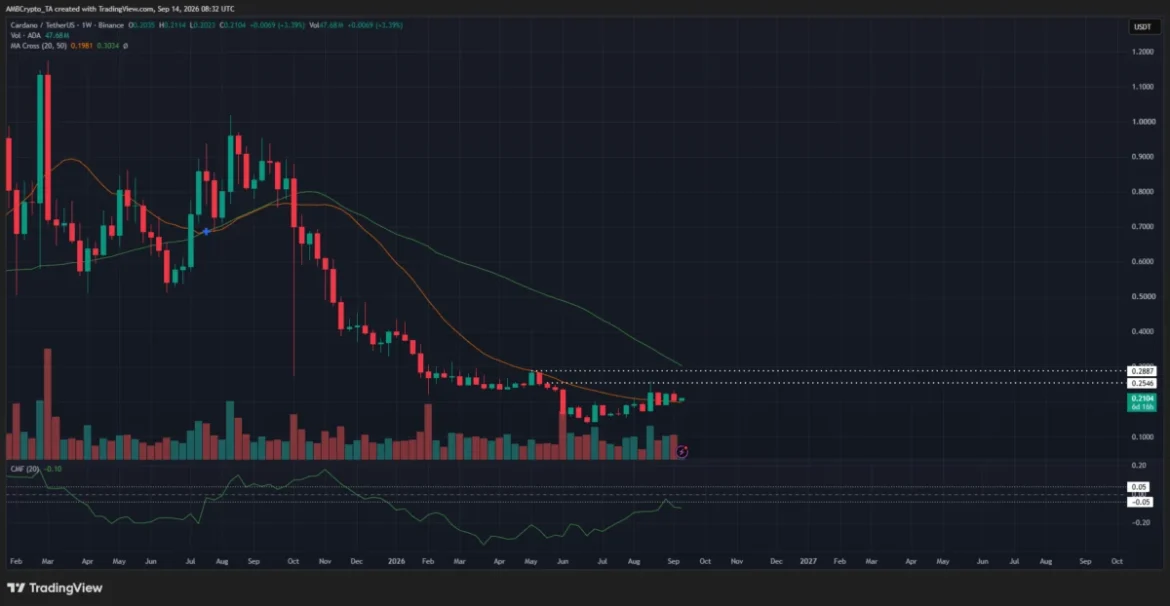
The origins of Cardano’s current medium-term structure trace back to structural shifts initiated earlier in the year. The market trajectory underwent a notable change in June, when bullish momentum catalyzed a break in the prevailing swing structure. During this period, ADA successfully breached the previous lower high set at $0.1849, neutralizing the immediate bearish pressure that had characterized preceding months.

Following this structural breakout, ADA established a consistent uptrend, remaining comfortably above its 50-day moving average. Throughout the subsequent weeks, the asset benefited from renewed buying interest that mirrored Bitcoin’s aggressive climb toward and briefly past the $80,000 mark.
However, the rally encountered momentum friction over the past fortnight. Despite multiple attempts by buyers to drive valuations higher, ADA has thus far failed to establish a decisive new high above the $0.258 mark, highlighting the strength of the overhead supply zone located between $0.26 and $0.28.
Technical Analysis: Key Support and Resistance Zones
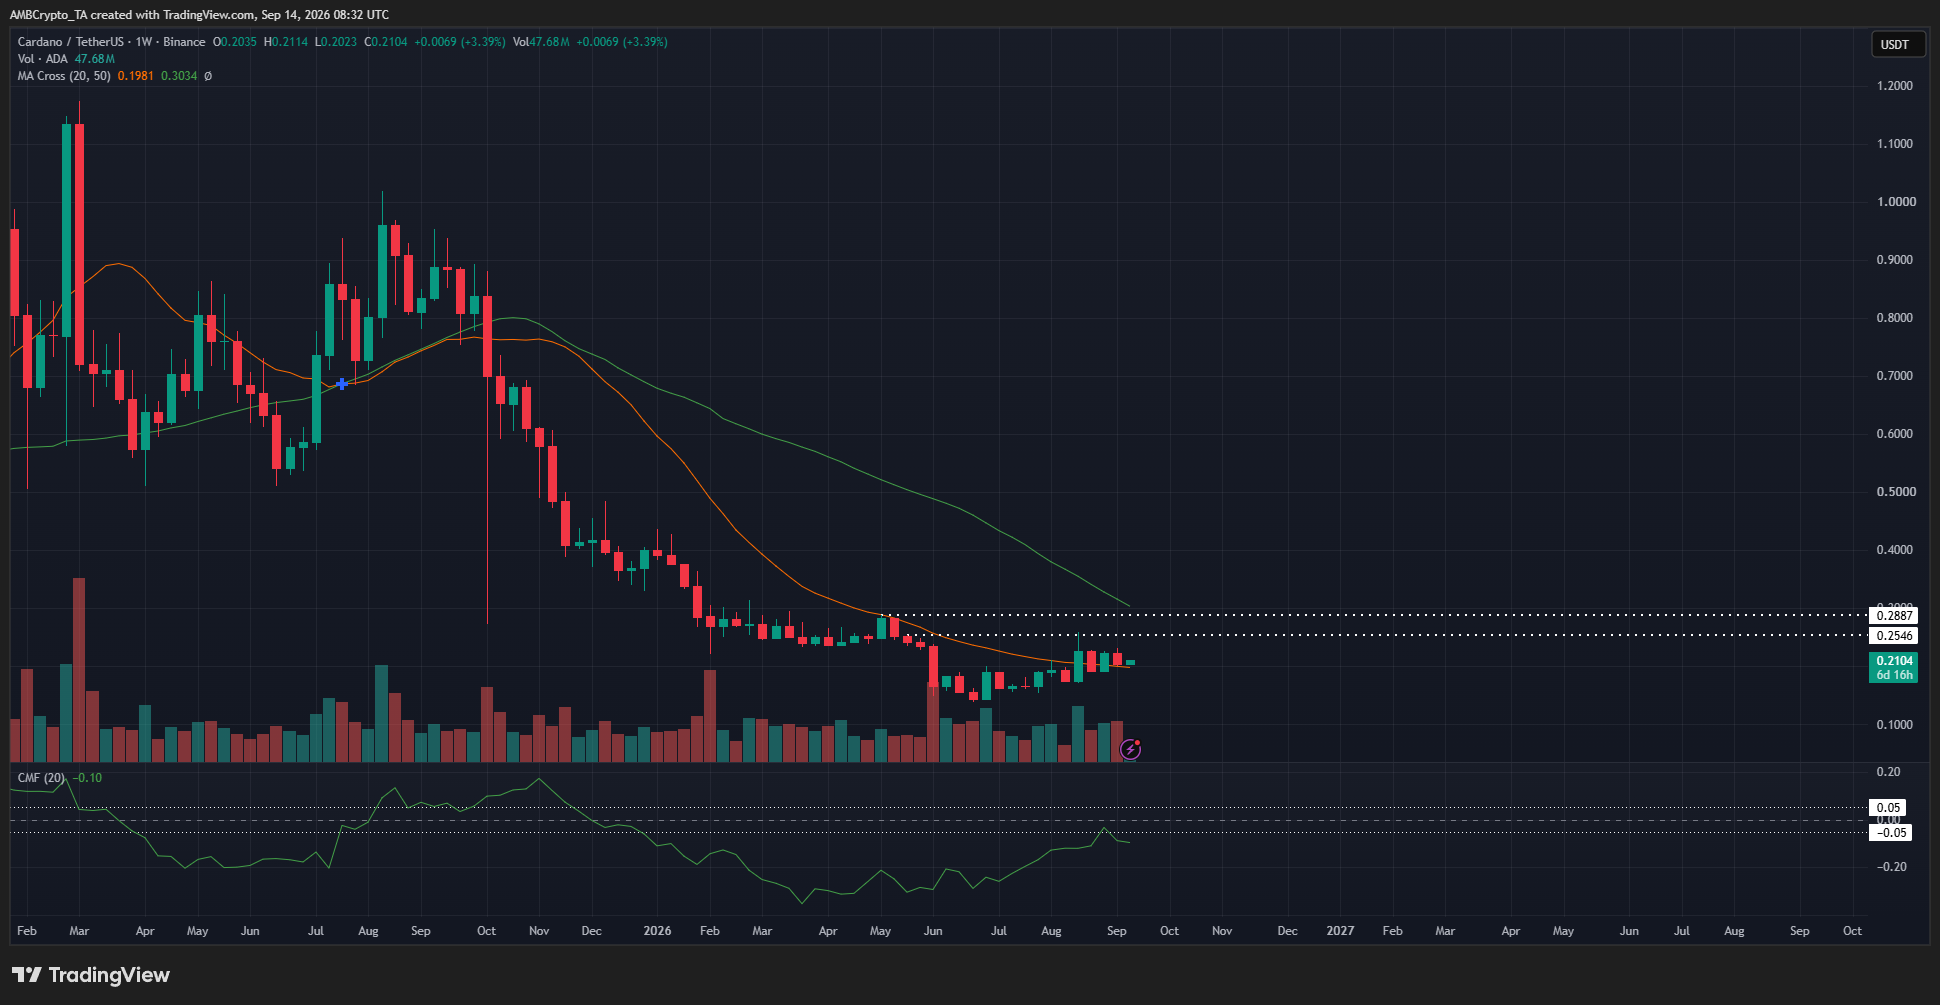
A granular examination of Cardano’s weekly and daily charts illustrates the delicate balance currently governing the asset’s valuation. On the weekly timeframe, ADA has climbed above its 20-week Moving Average, currently situated at $0.198. Successfully flipping this indicator into a reliable support level represents a positive development for intermediate-term bulls.
Nevertheless, the asset remains constrained beneath a formidable overhead supply region spanning from $0.26 to $0.28. Market technicians emphasize that the $0.2887 swing high, recorded in May, serves as the definitive watershed moment for the market. Until this threshold is decisively breached on high volume, long-term investors may remain skeptical regarding the permanence of the current uptrend.
Furthermore, volume and capital flow indicators introduce a note of caution. The Chaikin Money Flow (CMF) on the weekly timeframe currently registers at -0.10. This negative reading indicates ongoing capital outflows from the Cardano market on a macro scale, suggesting that the recent price appreciation may be occurring on relatively thin liquidity rather than robust, sustained institutional accumulation.
Trader Sentiment and Risk Management Strategies
In light of the conflicting technical signals, market analysts and swing traders are recalibrating their strategies. The broader market structure remains technically bullish as long as ADA trades above its 50-day moving average and defends the vital $0.20 support floor.
For active traders, the prevailing advisory centers around disciplined risk management. A measured price advance toward the $0.26 resistance zone is frequently cited by market observers as a logical window for taking partial profits, particularly given the historical selling pressure observed in that region. Conversely, a decisive breakdown below the $0.20 support area would invalidate the current bullish thesis, signaling an impending shift toward a more pronounced corrective phase.
Should the bulls muster sufficient momentum to shatter the $0.26–$0.28 supply barrier and subsequently flip that range into established support, analysts suggest that a more favorable environment for long-term position accumulation could materialize.
Broader Impact and Implications for the Cardano Ecosystem
The interplay between Cardano’s price action and its technical barriers carries broader implications for the network’s broader community and developer ecosystem. Sustained valuation stability above foundational support levels reinforces confidence among decentralized application (dApp) developers and liquidity providers operating on the network.
At the same time, overcoming persistent overhead resistance is critical for attracting fresh capital inflows, which in turn fuel network activity, transaction volume, and total value locked (TVL) within decentralized finance (DeFi) protocols on Cardano. As the market digests recent gains and monitors Bitcoin’s next directional move, Cardano’s capacity to defend its newly established floors while challenging upper resistance levels will determine its relative performance within the competitive alternative layer-1 landscape throughout the remainder of the quarter.
